Page 425 - Contributed Paper Session (CPS) - Volume 6
P. 425
CPS2008 Syafrina A.H et al.
                                      () = ∑   log [( |)]
                                              =1

            Goodness of Fit (GOF) tests
                The null and alternative hypotheses of the goodness of fit tests are the
            data follow a specified distribution and the  data do not follow the specified
            distribution, respectively.
             i.  Cramer-von Mises (CvM) test
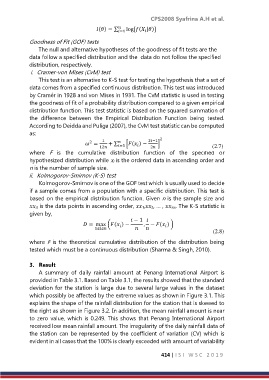
                This test is an alternative to K-S test for testing the hypothesis that a set of
            data comes from a specified continuous distribution. This test was introduced
            by Cramér in 1928 and von Mises in 1931. The CvM statistic is used in testing
            the goodness of fit of a probability distribution compared to a given empirical
            distribution function. This test statistic is based on the squared summation of
            the  difference  between  the  Empirical  Distribution  Function  being  tested.
            According to Deidda and Puliga (2007), the CvM test statistic can be computed
            as:
                                                              2
                                   2
                                     =  1  + ∑   [( ) −  2−1 ]

                                       12   =1         2                    (2.7)
            where  F  is  the  cumulative  distribution  function  of  the  specified  or
            hypothesized distribution while xi is the ordered data in ascending order and
            n is the number of sample size.
            ii.  Kolmogorov-Smirnov (K-S) test
                Kolmogorov-Smirnov is one of the GOF test which is usually used to decide
            if a sample comes from a population with a specific distribution. This test is
            based on the empirical distribution function. Given n is the sample size and
             is the data points in ascending order, 1,2, … , . The K-S statistic is
            given by,
                                                    − 1
                                     = max (( ) −  , − ( ) )


                                     1≤≤
                                                                                   (2.8)
            where F is the theoretical cumulative distribution of the distribution being
            tested which must be a continuous distribution (Sharma & Singh, 2010).

            3.  Result
                A  summary  of  daily  rainfall  amount  at  Penang  International  Airport  is
            provided in Table 3.1. Based on Table 3.1, the results showed that the standard
            deviation for the station is large due to several large values in the dataset
            which possibly be affected by the extreme values as shown in Figure 3.1. This
            explains the shape of the rainfall distribution for the station that is skewed to
            the right as shown in Figure 3.2. In addition, the mean rainfall amount is near
            to zero value, which is 0.249. This shows that Penang International Airport
            received low mean rainfall amount. The irregularity of the daily rainfall data of
            the station can be represented by the coefficient of variation (CV) which is
            evident in all cases that the 100% is clearly exceeded with amount of variability

                                                               414 | I S I   W S C   2 0 1 9

