
Page 426 - Contributed Paper Session (CPS) - Volume 6
P. 426
CPS2008 Syafrina A.H et al.
of rainfall is 250.20%. As shown in the Figure 3.3, the highest amount of rainfall
is recorded during the month of October, followed by September and
November. These results could be explained by the influences of the monsoon.
Intermonsoon occurred starting from September to October. The result shows
that Penang International Airport experienced maximal rainfall during inter-
monsoon.
Table 3.1. Summary of daily rainfall at Penang International Airport from the year
1990 until 2017
Minimum Median Mean Standard Maximum Coefficient 95%
(mm) (mm) (mm) Deviation (mm) of Confidence
(mm) Variation Interval (mm)
(100%)
0.000 0.000 0.249 0.623 14.250 250.20 (0.237,0.261)
Gamma distribution is denoted by ~Γ(, ), while Weibull
distribution is denoted by ∼ (, ), which is and are for
shape and scale respectively. Based on Table 3.1, the value of shape parameter
for Gamma distribution is 2.79707801 while the value of scale parameter is
0.48540250. Meanwhile, shape parameter of Weibull distribution gives a value
of 1.51149743 while the scale parameter gives a value of 1.52373851. The
shape parameter describes the curve of the graph where it is positively
skewed. In order to test the performance of the fitted model, the GOF test was
performed for daily rainfall data in Penang International Airport. The statistical
2
tests used in this study are CvM ( ) and K-S () tests. The highest total score
of the test identify the best statistical model between Gamma distribution and
Weibull distribution.
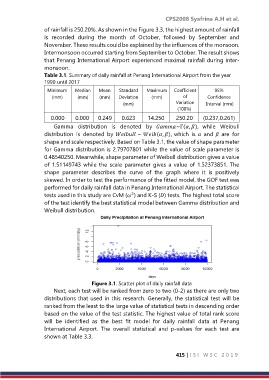
Figure 3.1. Scatter plot of daily rainfall data
Next, each test will be ranked from zero to two (0-2) as there are only two
distributions that used in this research. Generally, the statistical test will be
ranked from the least to the large value of statistical tests in descending order
based on the value of the test statistic. The highest value of total rank score
will be identified as the best fit model for daily rainfall data at Penang
International Airport. The overall statistical and p-values for each test are
shown at Table 3.3.
415 | I S I W S C 2 0 1 9