
Page 428 - Contributed Paper Session (CPS) - Volume 6
P. 428
CPS2008 Syafrina A.H et al.
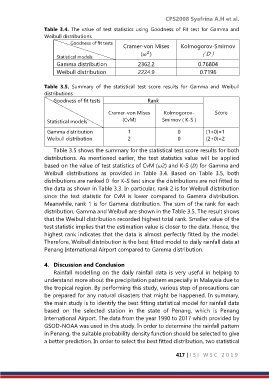
Table 3.4. The value of test statistics using Goodness of Fit test for Gamma and
Weibull distributions
Goodness of fit tests Cramer-von Mises Kolmogorov-Smirnov
2
Statistical models ( ) ( D )
Gamma distribution 2362.2 0.76804
Weibull distribution 2224.9 0.7196
Table 3.5. Summary of the statistical test score results for Gamma and Weibull
distributions
Goodness of fit tests Rank
Cramer-von Mises Kolmogorov- Score
Statistical models (CvM) Smirnov ( K-S )
Gamma distribution 1 0 (1+0)=1
Weibull distribution 2 0 (2+0)=2
Table 3.5 shows the summary for the statistical test score results for both
distributions. As mentioned earlier, the test statistics value will be applied
based on the value of test statistics of CvM (2) and K-S () for Gamma and
Weibull distributions as provided in Table 3.4. Based on Table 3.5, both
distributions are ranked 0 for K-S test since the distributions are not fitted to
the data as shown in Table 3.3. In particular, rank 2 is for Weibull distribution
since the test statistic for CvM is lower compared to Gamma distribution.
Meanwhile, rank 1 is for Gamma distribution. The sum of the rank for each
distribution, Gamma and Weibull are shown in the Table 3.5. The result shows
that the Weibull distribution recorded highest total rank. Smaller value of the
test statistic implies that the estimation value is closer to the data. Hence, the
highest rank indicates that the data is almost perfectly fitted by the model.
Therefore, Weibull distribution is the best fitted model to daily rainfall data at
Penang International Airport compared to Gamma distribution.
4. Discussion and Conclusion
Rainfall modelling on the daily rainfall data is very useful in helping to
understand more about the precipitation pattern especially in Malaysia due to
the tropical region. By performing this study, various step of precautions can
be prepared for any natural disasters that might be happened. In summary,
the main study is to identify the best fitting statistical model for rainfall data
based on the selected station in the state of Penang, which is Penang
International Airport. The data from the year 1990 to 2017 which provided by
GSOD-NOAA was used in this study. In order to determine the rainfall pattern
in Penang, the suitable probability density function should be selected to give
a better prediction. In order to select the best fitted distribution, two statistical
417 | I S I W S C 2 0 1 9