
Page 240 - Invited Paper Session (IPS) - Volume 1
P. 240
IPS 151 Rub´en C.
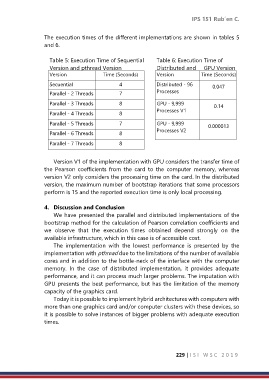
The execution times of the different implementations are shown in tables 5
and 6.
Table 5: Execution Time of Sequential Table 6: Execution Time of
Version and pthread Version Distributed and GPU Version
Version Time (Seconds) Version Time (Seconds)
Secuential 4 Distributed - 96 0.047
Parallel - 2 Threads 7 Processes
Parallel - 3 Threads 8 GPU - 9,999 0.14
Parallel - 4 Threads 8 Processes V1
Parallel - 5 Threads 7 GPU - 9,999 0.000013
Parallel - 6 Threads 8 Processes V2
Parallel - 7 Threads 8
Version V1 of the implementation with GPU considers the transfer time of
the Pearson coefficients from the card to the computer memory, whereas
version V2 only considers the processing time on the card. In the distributed
version, the maximum number of bootstrap iterations that some processors
perform is 15 and the reported execution time is only local processing.
4. Discussion and Conclusion
We have presented the parallel and distributed implementations of the
bootstrap method for the calculation of Pearson correlation coefficients and
we observe that the execution times obtained depend strongly on the
available infrastructure, which in this case is of accessible cost.
The implementation with the lowest performance is presented by the
implementation with pthread due to the limitations of the number of available
cores and in addition to the bottle-neck of the interface with the computer
memory. In the case of distributed implementation, it provides adequate
performance, and it can process much larger problems. The imputation with
GPU presents the best performance, but has the limitation of the memory
capacity of the graphics card.
Today it is possible to implement hybrid architectures with computers with
more than one graphics card and/or computer clusters with these devices, so
it is possible to solve instances of bigger problems with adequate execution
times.
229 | I S I W S C 2 0 1 9