
Page 422 - Invited Paper Session (IPS) - Volume 1
P. 422
IPS173 Alexandre Fortier-Labonté et al.
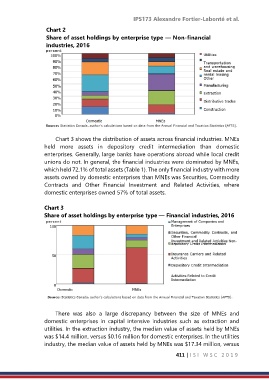
Chart 2
Share of asset holdings by enterprise type — Non-financial
industries, 2016
Chart 3 shows the distribution of assets across financial industries. MNEs
held more assets in depository credit intermediation than domestic
enterprises. Generally, large banks have operations abroad while local credit
unions do not. In general, the financial industries were dominated by MNEs,
which held 72.1% of total assets (Table 1). The only financial industry with more
assets owned by domestic enterprises than MNEs was Securities, Commodity
Contracts and Other Financial Investment and Related Activities, where
domestic enterprises owned 57% of total assets.
Chart 3
Share of asset holdings by enterprise type — Financial industries, 2016
There was also a large discrepancy between the size of MNEs and
domestic enterprises in capital intensive industries such as extraction and
utilities. In the extraction industry, the median value of assets held by MNEs
was $14.4 million, versus $0.16 million for domestic enterprises. In the utilities
industry, the median value of assets held by MNEs was $17.34 million, versus
411 | I S I W S C 2 0 1 9