
Page 423 - Invited Paper Session (IPS) - Volume 1
P. 423
IPS173 Alexandre Fortier-Labonté et al.
$0.29 million for domestic enterprises. Earlier work (Baldwin and Gellatly) also
showed that MNEs were more likely to operate in large-firm industries with
significant economies of scale and capital intensity.
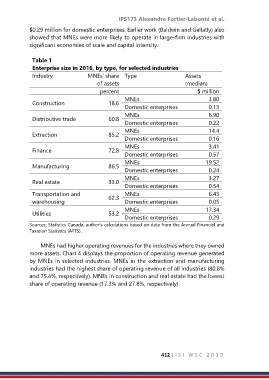
Table 1
Enterprise size in 2016, by type, for selected industries
Industry MNEs’ share Type Assets
of assets (median)
percent $ million
MNEs 3.80
Construction 18.6
Domestic enterprises 0.13
MNEs 6.90
Distributive trade 60.8
Domestic enterprises 0.22
MNEs 14.4
Extraction 85.2
Domestic enterprises 0.16
MNEs 3.41
Finance 72.8
Domestic enterprises 0.57
MNEs 19.52
Manufacturing 86.5
Domestic enterprises 0.24
MNEs 3.27
Real estate 33.0
Domestic enterprises 0.54
Transportation and 62.3 MNEs 6.43
warehousing Domestic enterprises 0.05
MNEs 17.34
Utilities 53.2
Domestic enterprises 0.29
Sources: Statistics Canada, author’s calculations based on data from the Annual Financial and
Taxation Statistics (AFTS).
MNEs had higher operating revenues for the industries where they owned
more assets. Chart 4 displays the proportion of operating revenue generated
by MNEs in selected industries. MNEs in the extraction and manufacturing
industries had the highest share of operating revenue of all industries (80.8%
and 75.4%, respectively). MNEs in construction and real estate had the lowest
share of operating revenue (17.3% and 27.8%, respectively).
412 | I S I W S C 2 0 1 9