
Page 151 - Special Topic Session (STS) - Volume 2
P. 151
STS474 Gigih F. et al.
3. Result
3.1 Breakpoint Analysis of US Regional Data
3.1.1 By Spatially-Independent Model
st
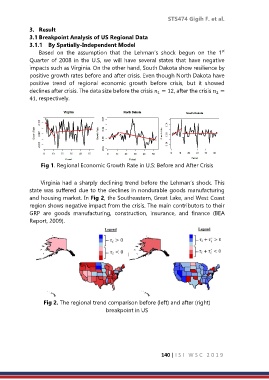
Based on the assumption that the Lehman’s shock begun on the 1
Quarter of 2008 in the U.S, we will have several states that have negative
impacts such as Virginia. On the other hand, South Dakota show resilience by
positive growth rates before and after crisis. Even though North Dakota have
positive trend of regional economic growth before crisis, but it showed
declines after crisis. The data size before the crisis = 12, after the crisis =
1
2
41, respectively.
Fig 1. Regional Economic Growth Rate in U.S: Before and After Crisis
Virginia had a sharply declining trend before the Lehman’s shock. This
state was suffered due to the declines in nondurable goods manufacturing
and housing market. In Fig 2, the Southeastern, Great Lake, and West Coast
region shows negative impact from the crisis. The main contributors to their
GRP are goods manufacturing, construction, insurance, and finance (BEA
Report, 2009).
Fig 2. The regional trend comparison before (left) and after (right)
breakpoint in US
140 | I S I W S C 2 0 1 9