
Page 152 - Special Topic Session (STS) - Volume 2
P. 152
STS474 Gigih F. et al.
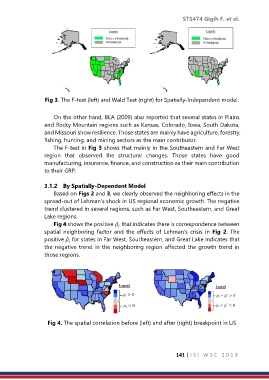
Fig 3. The F-test (left) and Wald Test (right) for Spatially-Independent model.
On the other hand, BEA (2009) also reported that several states in Plains
and Rocky Mountain regions such as Kansas, Colorado, Iowa, South Dakota,
and Missouri show resilience. Those states are mainly have agriculture, forestry,
fishing, hunting, and mining sectors as the main contributor.
The F-test in Fig 3 shows that mainly in the Southeastern and Far West
region that observed the structural changes. Those states have good
manufacturing, insurance, finance, and construction as their main contribution
to their GRP.
3.1.2 By Spatially-Dependent Model
Based on Figs 2 and 3, we clearly observed the neighboring effects in the
spread-out of Lehman’s shock in US regional economic growth. The negative
trend clustered in several regions, such as Far West, Southeastern, and Great
Lake regions.
Fig 4 shows the positive ̂ that indicates there is correspondence between
spatial neighboring factor and the effects of Lehman’s crisis in Fig 2. The
positive ̂ for states in Far West, Southeastern, and Great Lake indicates that
the negative trend in the neighboring region affected the growth trend in
those regions.
Fig 4. The spatial correlation before (left) and after (right) breakpoint in US
141 | I S I W S C 2 0 1 9