
Page 146 - Special Topic Session (STS) - Volume 2
P. 146
STS474 Takaki S. et al.
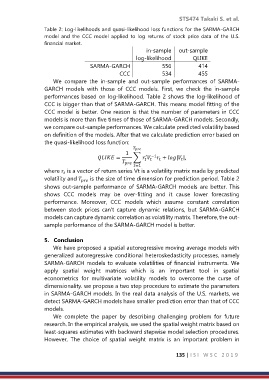
Table 2: Log-likelihoods and quasi-likelihood loss functions for the SARMA-GARCH
model and the CCC model applied to log returns of stock price data of the U.S.
financial market.
in-sample out-sample
log-likelihood QLIKE
SARMA-GARCH 556 414
CCC 534 455
We compare the in-sample and out-sample performances of SARMA-
GARCH models with those of CCC models. First, we check the in-sample
performances based on log-likelihood. Table 2 shows the log-likelihood of
CCC is bigger than that of SARMA-GARCH. This means model fitting of the
CCC model is better. One reason is that the number of parameters in CCC
models is more than five times of those of SARMA-GARCH models. Secondly,
we compare out-sample performances. We calculate predicted volatility based
on definition of the models. After that we calculate prediction error based on
the quasi-likelihood loss function:
1
′
= ∑ −1 + | |,
=1
where is a vector of return series Vt is a volatility matrix made by predicted
volatility and is the size of time dimension for prediction period. Table 2
shows out-sample performance of SARMA-GARCH models are better. This
shows CCC models may be over-fitting and it cause lower forecasting
performance. Moreover, CCC models which assume constant correlation
between stock prices can't capture dynamic relations, but SARMA-GARCH
models can capture dynamic correlation as volatility matrix. Therefore, the out-
sample performance of the SARMA-GARCH model is better.
5. Conclusion
We have proposed a spatial autoregressive moving average models with
generalized autoregressive conditional heteroskedasticity processes, namely
SARMA-GARCH models to evaluate volatilities of financial instruments. We
apply spatial weight matrices which is an important tool in spatial
econometrics for multivariate volatility models to overcome the curse of
dimensionality. we propose a two step procedure to estimate the parameters
in SARMA-GARCH models. In the real data analysis of the U.S. markets, we
detect SARMA-GARCH models have smaller prediction error than that of CCC
models.
We complete the paper by describing challenging problem for future
research. In the empirical analysis, we used the spatial weight matrix based on
least-squares estimates with backward stepwise model selection procedures.
However, The choice of spatial weight matrix is an important problem in
135 | I S I W S C 2 0 1 9