Page 215 - Special Topic Session (STS) - Volume 2
P. 215

STS486 Tonio D.B. et al.
            where () is normally distributed with mean 0 and covariance matrix Σ , 
                                                                                    
            is  the  smoothing  parameter  and  Σ       is  the  covariance  matrix  of
                                                                    ∗
                                                        ∗
             (), … . ,  (). We indicate with  ∗  = ( (), … . ,  ()) the bootstrap
                                                                   
                                                        1
                        
              1
            sample statistic of the generic b-th replication, with b=1,…,B. The ordering of
            the  bootstrap  statistic  is  obtained  by  introducing  a  suitable  distance,
            ((),  ()), using e.g.:
                     ∗
                                            2
                     2
                                         ∗
                -    -metric: (∫(() −  ) ) 1/2
                                                                               ∗
                                    ∞
                                                        ∗
                -   The supremum  -metric : ||() −  ()|| =  |() −  ()|
                                                                     
                Thus, it is easy to define the (1 − )% bootstrap confidence band such that
            ((),  ()) ≤   with   the (1 − )% quantile of the distances between
                     ∗
                               
                                       
            the bootstrap re-samples and the sample estimate. As shown by Cuevas et al.
            (2006),  the  performances  of  the  bootstrap  approximations  via  extensive
            simulations  and  real  data  applications  provides  asymptotic  validity  results
            without the strong assumption of normality.

            3.  Result: Application to the Rivers of Lazio
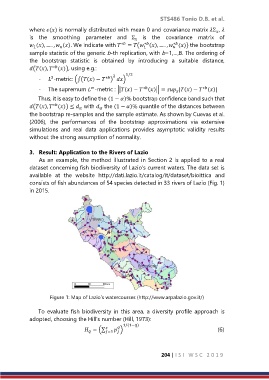
                As an example, the method illustrated in Section 2 is applied to a real
            dataset concerning fish biodiversity of Lazio’s current waters. The data set is
            available  at  the  website  http://dati.lazio.it/catalog/it/dataset/bioittica  and
            consists of fish abundances of 54 species detected in 33 rivers of Lazio (Fig. 1)
            in 2015.


                    Figure 1: Map of Lazio’s watercourses (http://www.arpalazio.gov.it/)

                To evaluate fish biodiversity in this area,  a  diversity profile approach is
            adopted, choosing the Hill’s number (Hill, 1973):

                                              
                                                = (∑  =1  ) 1/(1−)                                                   (6)


                                                               204 | I S I   W S C   2 0 1 9
   210   211   212   213   214   215   216   217   218   219   220