
Page 347 - Special Topic Session (STS) - Volume 2
P. 347
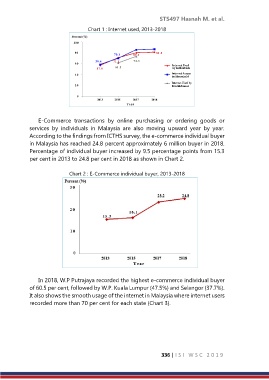
Chart 1 : Internet used, 2013-2018

                                                              STS497 Hasnah M. et al.
                                   Chart 1 : Internet used, 2013-2018

                             Percent (%)

                             100
                              8 0            70.1    85.7    87.0
                                                             81.2
                                      58.6   71.1   80.1
                                                    73.3
                              6 0     57.0   61.5                  Internet Used
                                                                   by Individuals
                              4 0                                  Internet Access
                                                                   by Household
                              2 0                                  Internet Used by
                                                                   Establishment
                               0      2013   2015   2017   2018
                                                  Year

                E-Commerce  transactions  by  online  purchasing  or  ordering  goods  or
            services  by  individuals  in  Malaysia  are  also  moving  upward  year  by  year.
            According to the findings from ICTHS survey, the e-commerce individual buyer
            in Malaysia has reached 24.8 percent approximately 6 million buyer in 2018.
            Percentage of individual buyer increased by 9.5 percentage points from 15.3
            per cent in 2013 to 24.8 per cent in 2018 as shown in Chart 2.

                            Chart 2 : E-Commerce individual buyer, 2013-2018


                In 2018, W.P Putrajaya recorded the highest e-commerce individual buyer
            of 60.5 per cent, followed by W.P. Kuala Lumpur (47.5%) and Selangor (37.7%).
            It also shows the smooth usage of the internet in Malaysia where internet users
            recorded more than 70 per cent for each state (Chart 3).


                                                               336 | I S I   W S C   2 0 1 9