Page 353 - Special Topic Session (STS) - Volume 2
P. 353
STS498 Wei-Yin L.


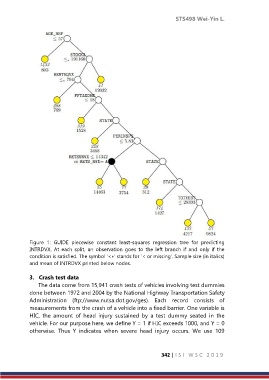
            Figure  1:  GUIDE  piecewise  constant  least-squares  regression  tree  for  predicting
            INTRDVX.  At  each  split,  an  observation  goes  to  the  left  branch  if  and  only  if  the
            condition is satisfied. The symbol ‘<∗’ stands for ‘< or missing’. Sample size (in italics)
            and mean of INTRDVX printed below nodes.

            3.  Crash test data
                The data come from 15,941 crash tests of vehicles involving test dummies
            done between 1972 and 2004 by the National Highway Transportation Safety
            Administration  (ftp://www.nutsa.dot.gov/ges).  Each  record  consists  of
            measurements from the crash of a vehicle into a fixed barrier. One variable is
            HIC,  the  amount  of  head  injury  sustained  by  a  test  dummy  seated  in  the
            vehicle. For our purpose here, we define Y = 1 if HIC exceeds 1000, and Y = 0
            otherwise.  Thus  Y  indicates  when  severe  head  injury  occurs.  We  use  109


                                                               342 | I S I   W S C   2 0 1 9

