
Page 282 - Special Topic Session (STS) - Volume 3
P. 282
STS544 Baoline C. et al.
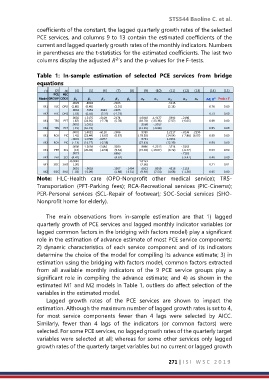
coefficients of the constant, the lagged quarterly growth rates of the selected
PCE services, and columns 9 to 13 contain the estimated coefficients of the
current and lagged quarterly growth rates of the monthly indicators. Numbers
in parentheses are the t-statistics for the estimated coefficients. The last two
columns display the adjusted ’s and the p-values for the F-tests.
2
Table 1: In-sample estimation of selected PCE services from bridge
equations
(1) (2) (3) (4) (5) (6) (7) (8) (9) (10) (11) (12) (13) (14) (15)
PCE HLC
Model GROUP CODE α 4 Adj Prob > F
.0029 .8994 .2205 .5115
M1 HLC OPO (1.85) (6.45) (2.01) (2.11) 0.76 0.00
.0016 .7253 .3663 -.2075
M2 HLC OPO (.83) (6.58) (2.32) (-1.23) 0.73 0.00
1.5175
M1 TRS PFT .0002 (24.95) -.6109 .2171 1.0010 -1.4177 .5992 -.2196 0.99 0.00
(5.78)
(-6.05)
(7.57)
(93.78) (-23.38)
(-7.78)
(.87)
.0002 1.0315 .9568 -.9917
M2 TRS PFT (.15) (16.73) (11.35) (-9.98) 0.95 0.00
.0001 1.4022 -.6120 .2306 .9950 2.2217 -.8236 .2295
M1 RCA PIC (.41) (23.44) (-8.07) (6.87) (.78.35) (14.04) (-7.86) (6.07) 0.99 0.00
-.0001 1.0726 -.0877 .9721 1.0101
M2 RCA PIC (-.13) (14.77) (-2.58) (27.43) (12.39) 0.98 0.00
.0000 1.2630 -.5484 .3280 .9896 -1.2615 .5514 -.3263
M1 PER SCL (13) (20.04) (-8.56) (9.54) (73.04) (-19.07) (8.72) (-8.77) 0.99 0.00
.0073 .6653 -.7182
M2 PER SCL (4.41) (4.62) (-3.47) 0.46 0.00
-0.0048 1.0153
M1 SOC SHO (.90) (2.66) 0.21 0.01
.0001 -.9010 .1567 -.1494 .6013 .8919 .4316 -.1119
M2 SOC SHO (-.03) (-5.09) (1.88) (-2.51) (9.92) (7.54) (4.68) (-1.56) 0.95 0.00
Note: HLC-Health care (OPO-Nonprofit other medical service); TRS-
Transportation (PFT-Parking fees); RCA-Recreational services (PIC-Cinema);
PER-Personal services (SCL-Repair of footwear); SOC-Social services (SHO-
Nonprofit home for elderly).
The main observations from in-sample estimation are that 1) lagged
quarterly growth of PCE services and lagged monthly indicator variables (or
lagged common factors in the bridging with factors model) play a significant
role in the estimation of advance estimate of most PCE service components;
2) dynamic characteristics of each service component and of its indicators
determine the choice of the model for compiling its advance estimate; 3) in
estimation using the bridging with factors model, common factors extracted
from all available monthly indicators of the 9 PCE service groups play a
significant role in compiling the advance estimate; and 4) as shown in the
estimated M1 and M2 models in Table 1, outliers do affect selection of the
variables in the estimated model.
Lagged growth rates of the PCE services are shown to impact the
estimation. Although the maximum number of lagged growth rates is set to 4,
for most service components fewer than 4 lags were selected by AICC.
Similarly, fewer than 4 lags of the indicators (or common factors) were
selected. For some PCE services, no lagged growth rates of the quarterly target
variables were selected at all; whereas for some other services only lagged
growth rates of the quarterly target variables but no current or lagged growth
271 | I S I W S C 2 0 1 9