
Page 284 - Special Topic Session (STS) - Volume 3
P. 284
STS544 Baoline C. et al.
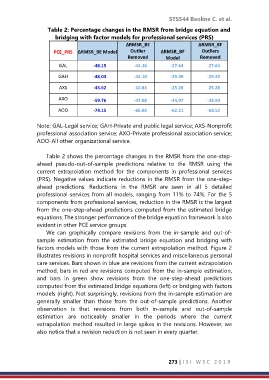
Table 2: Percentage changes in the RMSR from bridge equation and
bridging with factor models for professional services (PRS)
∆RMSR_BE ∆RMSR_BF
PCE_PRS ∆RMSR_BE Model Outlier ∆RMSR_BF Outliers
Removed Model Removed
GAL -48.15 -44.36 -27.64 -27.64
GAH -48.04 -44.10 -29.49 -29.49
AXS -43.62 -10.83 -25.28 -25.28
AXO -59.76 -47.08 -44.97 -38.90
AOO -74.15 -66.03 -62.21 -68.52
Note: GAL-Legal service; GAH-Private and public legal service; AXS-Nonprofit
professional association service; AXO-Private professional association service;
AOO-All other organizational service.
Table 2 shows the percentage changes in the RMSR from the one-step-
ahead pseudo-out-of-sample predictions relative to the RMSR using the
current extrapolation method for the components in professional services
(PRS). Negative values indicate reductions in the RMSR from the one-step-
ahead predictions. Reductions in the RMSR are seen in all 5 detailed
professional services from all models, ranging from 11% to 74%. For the 5
components from professional services, reduction in the RMSR is the largest
from the one-step-ahead predictions computed from the estimated bridge
equations. The stronger performance of the bridge equation framework is also
evident in other PCE service groups
We can graphically compare revisions from the in-sample and out-of-
sample estimation from the estimated bridge equation and bridging with
factors models with those from the current extrapolation method. Figure 2
illustrates revisions in nonprofit hospital services and miscellaneous personal
care services. Bars shown in blue are revisions from the current extrapolation
method, bars in red are revisions computed from the in-sample estimation,
and bars in green show revisions from the one-step-ahead predictions
computed from the estimated bridge equations (left) or bridging with factors
models (right). Not surprisingly, revisions from the in-sample estimation are
generally smaller than those from the out-of-sample predictions. Another
observation is that revisions from both in-sample and out-of-sample
estimation are noticeably smaller in the periods where the current
extrapolation method resulted in large spikes in the revisions. However, we
also notice that a revision reduction is not seen in every quarter.
273 | I S I W S C 2 0 1 9