
Page 264 - Contributed Paper Session (CPS) - Volume 2
P. 264
CPS1853 M. Irsyad Ilham
homoscedasticity, non-autocorrelation, and non-multi-collinearity. Special
case if the selected model is random effect, the harnessing of Generalized
Least Square (GLS) or Feasible GLS to estimate parameters has accommodate
the homoscedasticity and non-autocorrelation assumption. Hence, random
effect model uses assumption of normality and multi-collinearity (Heshmati et
al., 2015; Singer and Willett, 2003)
3. Result
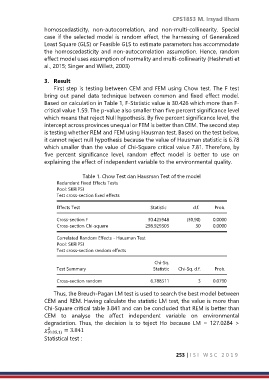
First step is testing between CEM and FEM using Chow test. The F test
bring out panel data technique between common and fixed effect model.
Based on calculation in Table 1, F-Statistic value is 30.426 which more than F-
critical value 1.59. The p-value also smaller than five percent significance level
which means that reject Null hypothesis. By five percent significance level, the
intercept across provinces unequal or FEM is better than CEM. The second step
is testing whether REM and FEM using Hausman test. Based on the test below,
it cannot reject null hypothesis because the value of Hausman statistic is 6.78
which smaller than the value of Chi-Square critical value 7.81. Therefore, by
five percent significance level, random effect model is better to use on
explaining the effect of independent variable to the environmental quality.
Table 1. Chow Test dan Hausman Test of the model
Redundant Fixed Effects Tests
Pool: SKRIPSI
Test cross-section fixed effects
Effects Test Statistic d.f. Prob.
Cross-section F 30.425948 (30,90) 0.0000
Cross-section Chi-square 298.929303 30 0.0000
Correlated Random Effects - Hausman Test
Pool: SKRIPSI
Test cross-section random effects
Chi-Sq.
Test Summary Statistic Chi-Sq. d.f. Prob.
Cross-section random 6.788311 3 0.0790
Thus, the Breuch-Pagan LM test is used to search the best model between
CEM and REM. Having calculate the statistic LM test, the value is more than
Chi-Square critical table 3.841 and can be concluded that REM is better than
CEM to analyse the affect independent variable on environmental
degradation. Thus, the decision is to teject Ho because LM = 127.0284 >
2
(0.05,1) = 3.841
Statistical test :
253 | I S I W S C 2 0 1 9