
Page 265 - Contributed Paper Session (CPS) - Volume 2
P. 265
CPS1853 M. Irsyad Ilham
∑ (∑ ) 2 2
= [ =1 =1 − 1]
2( − 1) ∑ ∑ 2
=1 =1
Calculation :
(31)(4) 3.0785 2
= [ − 1] = 127.0284
2(4 − 1) 0.8848
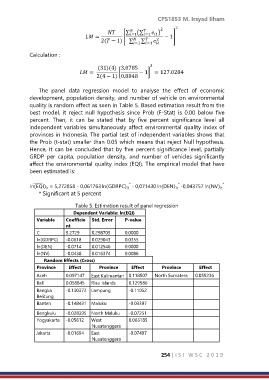
The panel data regression model to analyse the effect of economic
development, population density, and number of vehicle on environmental
quality is random effect as seen in Table 5. Based estimation result from the
best model, it reject null hypothesis since Prob (F-Stat) is 0.00 below five
percent. Then, it can be stated that by five percent significance level all
independent variables simultaneously affect environmental quality index of
provinces in Indonesia. The partial test of independent variables shows that
the Prob (t-stat) smaller than 0.05 which means that reject Null hypothesis.
Hence, it can be concluded that by five percent significance level, partially
GRDP per capita, population density, and number of vehicles significantly
affect the environmental quality index (EQI). The empirical model that have
been estimated is:
*
*
*
ln(EQI) = 5,272858 ‐ 0,061763 ln(GDRPC) ‐ 0,071430 ln(DEN) ‐0,043757 ln(NV)
̂
it
it
it
it
* Significant at 5 percent
Table 5. Estimation result of panel regression
Dependent Variable: ln(EQI)
Variable Coefficie Std. Error P-value
nt
C 5.2729 0.298705 0.0000
ln(GDRPC) -0.0618 0.029043 0.0355
ln(DEN) -0.0714 0.012546 0.0000
ln(NV) -0.0438 0.016374 0.0086
Random Effects (Cross)
Province Effect Province Effect Province Effect
Aceh 0.097147 East Kalimantan 0.118507 North Sumatera 0.055236
Bali 0.058845 Riau Islands 0.129586
Bangka -0.130372 Lampung -0.11052
Belitung
Banten -0.148431 Maluku -0.03397
Bengkulu -0.028395 North Maluku -0.07251
Yogyakarta -0.05612 West 0.063185
Nusatenggara
Jakarta -0.01694 East -0.07497
Nusatenggara
254 | I S I W S C 2 0 1 9