
Page 424 - Contributed Paper Session (CPS) - Volume 2
P. 424
CPS1915 Han G. et al.
ℎ () = ( − − ) / ( + − ). (4)
In order to make more sense of the relationship between sigmoid and tanh
function, we describe the relationship mathematically shown below:
ℎ () = 2 (2) − 1, (5)
which indicates that tanh is a rescaled sigmoid function. The first derivative of
tanh function can be expressed as follows:
2
′ ℎ () = 1 − (( − − )/( + − )) (6)
which can be rewritten as Equation (7) in order to embody the relationship
between tanh function and its derivative,
2
′ ℎ () = 1 − ℎ (). (7)
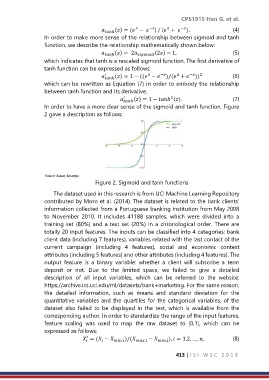
In order to have a more clear sense of the sigmoid and tanh function, Figure
2 gave a description as follows:
Figure 2. Sigmoid and tanh functions
The dataset used in this research is from UCI Machine Learning Repository
contributed by Moro et al. (2014). The dataset is related to the bank clients’
information collected from a Portuguese banking institution from May 2008
to November 2010. It includes 41188 samples, which were divided into a
training set (80%) and a test set (20%) in a chronological order. There are
totally 20 input features. The inputs can be classified into 4 categories: bank
client data (including 7 features), variables related with the last contact of the
current campaign (including 4 features), social and economic context
attributes (including 5 features) and other attributes (including 4 features). The
output feature is a binary variable: whether a client will subscribe a term
deposit or not. Due to the limited space, we failed to give a detailed
description of all input variables, which can be referred to the website:
https://archive.ics.uci.edu/ml/datasets/bank+marketing. For the same reason,
the detailed information, such as means and standard deviation for the
quantitative variables and the quartiles for the categorical variables, of the
dataset also failed to be displayed in the text, which is available from the
corresponding author. In order to standardize the range of the input features,
feature scaling was used to map the raw dataset to [0,1], which can be
expressed as follows:
′
= ( − , )/( , − , ), = 1,2, … , , (8)
413 | I S I W S C 2 0 1 9