
Page 426 - Contributed Paper Session (CPS) - Volume 2
P. 426
CPS1915 Han G. et al.
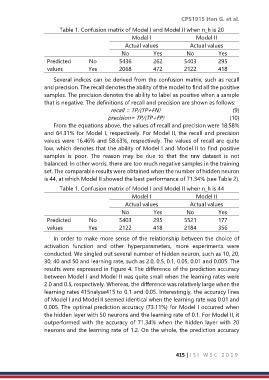
Table 1. Confusion matrix of Model I and Model II when n_h is 20
Model I Model II
Actual values Actual values
No Yes No Yes
Predicted No 5436 262 5403 295
values Yes 2068 472 2122 418
Several indices can be derived from the confusion matrix, such as recall
and precision. The recall denotes the ability of the model to find all the positive
samples. The precision denotes the ability to label as positive when a sample
that is negative. The definitions of recall and precision are shown as follows:
recall = TP/(TP+FN) (9)
precision= TP/(TP+FP) (10)
From the equations above, the values of recall and precision were 18.58%
and 64.31% for Model I, respectively. For Model II, the recall and precision
values were 16.46% and 58.63%, respectively. The values of recall are quite
low, which denotes that the ability of Model I and Model II to find positive
samples is poor. The reason may be due to that the raw dataset is not
balanced. In other words, there are too much negative samples in the training
set. The comparable results were obtained when the number of hidden neuron
is 44, at which Model II showed the best performance of 71.34% (see Table 2).
Table 1. Confusion matrix of Model I and Model II when n_h is 44
Model I Model II
Actual values Actual values
No Yes No Yes
Predicted No 5403 295 5521 177
values Yes 2122 418 2184 356
In order to make more sense of the relationship between the choice of
activation function and other hyperparameters, more experiments were
conducted. We singled out several number of hidden neuron, such as 10, 20,
30, 40 and 50 and learning rate, such as 2.0, 0.5, 0.1, 0.05, 0.01 and 0.005. The
results were expressed in Figure 4. The difference of the prediction accuracy
between Model I and Model II was quite small when the learning rates were
2.0 and 0.5, respectively. Whereas, the difference was relatively large when the
learning rates 415nalyse415 to 0.1 and 0.05. Interestingly, the accuracy lines
of Model I and Model II seemed identical when the learning rate was 0.01 and
0.005. The optimal prediction accuracy (73.11%) for Model I occurred when
the hidden layer with 50 neurons and the learning rate of 0.1. For Model II, it
outperformed with the accuracy of 71.34% when the hidden layer with 20
neurons and the learning rate of 1.2. On the whole, the prediction accuracy
415 | I S I W S C 2 0 1 9