
Page 443 - Contributed Paper Session (CPS) - Volume 2
P. 443
CPS1917 Trijya S.
( ) without an intercept term. That is, () = () + (). This
2
2
1
provides the estimates and .
̂
̂
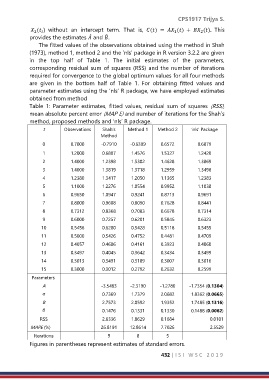
The fitted values of the observations obtained using the method in Shah
(1973), method 1, method 2 and the ‘nls’ package in R version 3.2.2 are given
in the top half of Table 1. The initial estimates of the parameters,
corresponding residual sum of squares (RSS) and the number of iterations
required for convergence to the global optimum values for all four methods
are given in the bottom half of Table 1. For obtaining fitted values and
parameter estimates using the ‘nls’ R package, we have employed estimates
obtained from method
Table 1: Parameter estimates, fitted values, residual sum of squares (RSS),
mean absolute percent error (MAP E) and number of iterations for the Shah’s
method, proposed methods and ‘nls’ R package.
t Observations Shah’s Method 1 Method 2 ‘nls’ Package
Method
0 0.7000 -0.7910 -0.6309 0.6572 0.6879
1 1.2000 0.6807 1.4576 1.5327 1.2420
2 1.4000 1.2398 1.5302 1.4628 1.3869
3 1.4000 1.3819 1.3718 1.2959 1.3496
4 1.2380 1.3417 1.2050 1.1365 1.2383
5 1.1000 1.2276 1.0554 0.9952 1.1038
6 0.9650 1.0947 0.9241 0.8713 0.9691
7 0.8000 0.9608 0.8090 0.7628 0.8441
8 0.7312 0.8368 0.7083 0.6678 0.7314
9 0.6000 0.7257 0.6201 0.5846 0.6323
10 0.5456 0.6280 0.5428 0.5118 0.5455
11 0.5000 0.5426 0.4752 0.4481 0.4709
12 0.4057 0.4686 0.4161 0.3923 0.4060
13 0.3497 0.4045 0.3642 0.3434 0.3499
14 0.3013 0.3491 0.3189 0.3007 0.3016
15 0.3000 0.3012 0.2792 0.2632 0.2599
Parameters
A -3.5483 -2.3190 -1.2780 -1.7354 (0.1304)
α 0.7369 1.7379 2.0682 1.8362 (0.0665)
B 2.7573 2.0592 1.9352 1.7485 (0.1316)
β 0.1476 0.1331 0.1330 0.1488 (0.0062)
RSS 2.6336 1.8629 0.1684 0.0101
MAPE (%) 26.8191 12.8614 7.7026 2.5529
Iterations 9 8 5
Figures in parentheses represent estimates of standard errors.
432 | I S I W S C 2 0 1 9