
Page 450 - Contributed Paper Session (CPS) - Volume 2
P. 450
CPS1922 Imran K. et al.
Examples:
Table-1
Training
Group Gender Age (years)* Height (m)† Mass (kg)§ BMI (years)∥ Prof (years)
Prof-Sr 20 F 27.35±3.83 1.66±0.06 55.08±3.52 19.98±1.36 19.85±6.11 7.35±3.69
18 M 26.67±3.48 1.80±0.06 75.48±5.14 23.27±1.33 14.44±4.06 8.39±0.5
38 Total 27.03±3.64 1.73±0.09 64.75±11.18 21.54±2.13 17.29±5.85 7.84±3.85
Prof-Jr 30 F 21.17±1.56 1.65±0.05 54.39±5.19 19.97±1.43 13.83±5.11 1.07±0.98
30 M 21.63±1.79 1.77±0.07 70.46±8.67 22.37±2.20 10.73±3.42 0.93±0.78
60 Total 21.40±1.68 1.71±0.09 62.43±10.76 21.17±2.13 12.28±4.58 1.00±0.88
BFA-1 333 F 18.02±0.85 1.65±0.08 56.09±5.58 20.68±1.99 11.72±3.38 0±0
65 M 18.33±1.00 1.76±0.05 68.82±6.27 22.16±2.20 7.10±4.11 0±0
401 Total 18.07±0.87 1.67±0.08 58.33±7.49 21.43±1.99 10.91±3.93 0±0
BFA-2 69 F 19.16±3.12 1.62±0.06 58.65±8.58 22.27±2.49 10.62±4.80 0±0
9 M 19.22±1.20 1.77±0.06 67.48±7.11 21.62±1.91 5.89±5.21 0±0
78 Total 19.17±2.96 1.64±0.08 59.67±8.85 22.20±2.43 10.07±5.04 0±0
Total 452 F 18.82±2.62 1.64±0.07 56.35±6.12 20.85±2.10 12.06±4.30 0.39±1.72
125 M 20.35±3.39 1.77±0.06 70.06±7.15 22.33±1.73 8.91±4.85 1.41±3.26
577 All 19.17±2.88 1.67±0.09 59.37±8.52 21.17±2.11 11.36±4.61 0.62±2.19
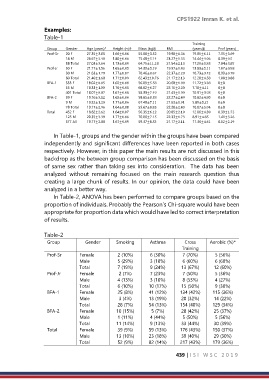
In Table-1, groups and the gender within the groups have been compared
independently and significant differences have been reported in both cases
respectively. However, in this paper the main results are not discussed in this
backdrop as the between group comparison has been discussed on the basis
of same sex rather than taking sex into consideration. The data has been
analyzed without remaining focused on the main research question thus
creating a large chunk of results. In our opinion, the data could have been
analyzed in a better way.
In Table-2, ANOVA has been performed to compare groups based on the
proportion of individuals. Probably the Pearson’s Chi-square would have been
appropriate for proportion data which would have led to correct interpretation
of results.
Table-2
Group Gender Smoking Asthma Cross Aerobic (%)*
Training
Prof-Sr Female 2 (10%) 6 (30%) 7 (70%) 5 (56%)
Male 5 (29%) 3 (18%) 6 (60%) 6 (60%)
Total 7 (19%) 9 (24%) 13 (67%) 12 (60%)
Prof-Jr Female 2 (7%) 7 (23%) 7 (50%) 5 (36%)
Male 4 (13%) 3 (10%) 8 (53%) 4 (27%)
Total 6 (10%) 10 (17%) 15 (50%) 9 (30%)
BFA-1 Female 25 (8%) 41 (12%) 134 (42%) 115 (36%)
Male 3 (4%) 13 (19%) 20 (32%) 14 (22%)
Total 28 (7%) 54 (13%) 154 (40%) 129 (34%)
BFA-2 Female 10 (15%) 5 (7%) 28 (42%) 25 (37%)
Male 1 (11%) 4 (44%) 5 (50%) 5 (56%)
Total 11 (14%) 9 (13%) 33 (44%) 30 (39%)
Total Female 39 (9%) 59 (13%) 176 (43%) 150 (37%)
Male 13 (10%) 23 (18%) 39 (40%) 29 (30%)
Total 52 (9%) 82 (14%) 217 (43%) 179 (36%)
439 | I S I W S C 2 0 1 9