
Page 451 - Contributed Paper Session (CPS) - Volume 2
P. 451
CPS1922 Imran K. et al.
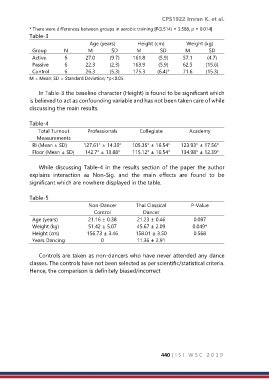
* There were differences between groups in aerobic training [F(3,514) = 3.588, p = 0.014]
Table-3
Age (years) Height (cm) Weight (kg)
Group N M SD M SD M SD
Active 6 27.0 (9.7) 161.8 (5.9) 57.1 (4.7)
Passive 6 22.3 (2.3) 163.9 (5.9) 62.5 (15.6)
Control 6 26.3 (5.3) 175.3 (6.4)* 71.6 (15.3)
M = Mean; SD = Standard Deviation; *p<0.05.
In Table-3 the baseline character (Height) is found to be significant which
is believed to act as confounding variable and has not been taken care of while
discussing the main results.
Table-4
Total Turnout Professionals Collegiate Academy
Measurements
RI (Mean ± SD) 127.61° ± 14.39° 105.35° ± 16.54° 123.93° ± 17.56°
Floor (Mean ± SD) 142.7° ± 13.88° 115.12° ± 16.54° 134.98° ± 12.39°
While discussing Table-4 in the results section of the paper the author
explains interaction as Non-Sig. and the main effects are found to be
significant which are nowhere displayed in the table.
Table-5
Non-Dancer Thai Classical P-Value
Control Dancer
Age (years) 21.16 ± 0.38 21.23 ± 0.46 0.087
Weight (kg) 51.42 ± 5.07 45.67 ± 2.09 0.049*
Height (cm) 156.73 ± 3.46 158.01 ± 3.50 0.568
Years Dancing 0 11.36 ± 2.91
Controls are taken as non-dancers who have never attended any dance
classes. The controls have not been selected as per scientific/statistical criteria.
Hence, the comparison is definitely biased/incorrect
440 | I S I W S C 2 0 1 9