Page 50 - Contributed Paper Session (CPS) - Volume 2
P. 50

CPS1416 Jungtaek O. et al.
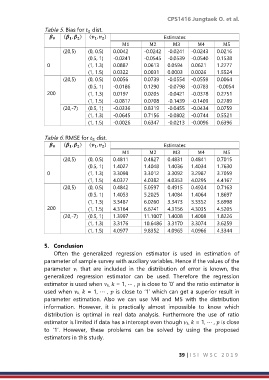
                  Table 5. Bias for   dist.
                                   5
                        ( ,  )   ( ,  )               Estimates


                                                M1        M2       M3        M4        M5
                         (20,5)    (0, 0.5)    0.0042    -0.0242   -0.0241   -0.0243    0.0216
                                   (0.5, 1)    -0.0241    -0.0545   -0.0539   -0.0540    0.1538
                   0               (1, 1.3)    0.0887    0.0613    0.0594    0.0621    1.2777
                                   (1, 1.5)    0.0322    0.0031    0.0003    0.0026    1.5524
                         (20,5)    (0, 0.5)    0.0056    0.0739    -0.0554   -0.0559    0.0064
                                   (0.5, 1)    -0.0186    0.1290    -0.0798   -0.0783    -0.0054
                   200             (1, 1.3)    0.0197    0.0205    -0.0421   -0.0378    0.2751
                                   (1, 1.5)    -0.0817    0.0708    -0.1439   -0.1409    0.2789
                         (20,-7)   (0.5, 1)    -0.0336    0.8319    -0.0455   -0.0434    0.0759
                                   (1, 1.3)    -0.0645    0.7156    -0.0802   -0.0744    0.5521
                                   (1, 1.5)    -0.0026    0.6347    -0.0213   -0.0096    0.6396

                  Table 6. RMSE for   dist.
                                    5
                        ( ,  )   ( ,  )               Estimates


                                                M1        M2       M3        M4        M5
                         (20,5)    (0, 0.5)    0.4811    0.4827    0.4831    0.4841    0.7015
                                   (0.5, 1)    1.4027    1.4048    1.4036    1.4034    1.7630
                   0               (1, 1.3)    3.3098    3.3012    3.3092    3.2987    3.7059
                                   (1, 1.5)    4.0377    4.0382    4.0353    4.0295    4.4167
                         (20,5)    (0, 0.5)    0.4842    5.0597    0.4915    0.4924    0.7163
                                   (0.5, 1)    1.4053    5.2025    1.4084    1.4064    1.8697
                                   (1, 1.3)    3.3487    6.0260    3.3473    3.3352    3.6998
                   200             (1, 1.5)    4.3164    6.6741    4.3156    4.3035    4.5205
                         (20,-7)   (0.5, 1)    1.3997    11.1007   1.4008    1.4008    1.8226
                                   (1, 1.3)    3.3176    10.6486   3.3170    3.3074    3.6259
                                   (1, 1.5)    4.0977    9.8352    4.0965    4.0966    4.3344

                  5.  Conclusion
                      Often  the  generalized  regression  estimator  is  used  in  estimation  of
                  parameter of sample survey with auxiliary variables. Hence if the values of the
                  parameter    that  are  included  in  the  distribution  of  error  is  known,  the
                  generalized  regression  estimator  can  be  used.  Therefore  the  regression
                  estimator is used when ,  = 1, ⋯ ,  is close to ‘0’ and the ratio estimator is
                  used when ,  = 1, ⋯ ,  is close to ‘1’ which can get a superior result in
                  parameter  estimation.  Also  we  can  use  M4  and  M5  with  the  distribution
                  information.  However,  it  is  practically  almost  impossible  to  know  which
                  distribution  is  optimal  in  real  data  analysis.  Furthermore  the  use  of  ratio
                  estimator is limited if data has a intercept even though ,  = 1, ⋯ ,  is close
                  to  ‘1’.  However,  these  problems  can  be  solved  by  using  the  proposed
                  estimators in this study.


                                                                      39 | I S I   W S C   2 0 1 9
   45   46   47   48   49   50   51   52   53   54   55