
Page 72 - Contributed Paper Session (CPS) - Volume 2
P. 72
CPS1431 Salima M.
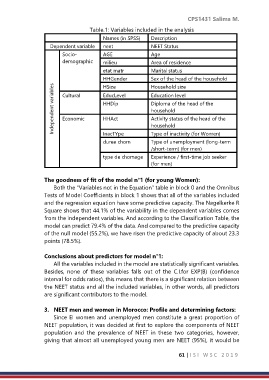
Table.1: Variables included in the analysis
Names (in SPSS) Description
Dependent variable neet NEET Status
Socio- AGE Age
demographic milieu Area of residence
etat matr Marital status
HHGender Sex of the head of the household
Independent variables Cultural EducLevel Education level
Household size
HSize
Diploma of the head of the
HHDip
household
Activity status of the head of the
Economic
HHAct
InacTYpe
Type of inactivity (for Women)
duree chom household
Type of unemployment (long-term
/short-term) (for men)
type de chomage Experience / first-time job seeker
(for men)
The goodness of fit of the model n°1 (for young Women):
Both the “Variables not in the Equation” table in block 0 and the Omnibus
Tests of Model Coefficients in block 1 shows that all of the variables included
and the regression equation have some predictive capacity. The Nagelkerke R
Square shows that 44.1% of the variability in the dependent variables comes
from the independent variables. And according to the Classification Table, the
model can predict 79.4% of the data. And compared to the predictive capacity
of the null model (55.2%), we have risen the predictive capacity of about 23.3
points (78.5%).
Conclusions about predictors for model n°1:
All the variables included in the model are statistically significant variables.
Besides, none of these variables falls out of the C.I.for EXP(B) (confidence
interval for odds ratios), this means that there is a significant relation between
the NEET status and all the included variables, in other words, all predictors
are significant contributors to the model.
3. NEET men and women in Morocco: Profile and determining factors:
Since EI women and unemployed men constitute a great proportion of
NEET population, it was decided at first to explore the components of NEET
population and the prevalence of NEET in these two categories, however,
giving that almost all unemployed young men are NEET (95%), it would be
61 | I S I W S C 2 0 1 9