
Page 71 - Contributed Paper Session (CPS) - Volume 2
P. 71
CPS1431 Salima M.
NEET who are unemployed are men (65.1%) and 9 economically inactive (EI)
NEET out of 10 are women (92.6%). Therefore, in this essay we will focus on
two sub-populations of the NEET population: NEET men and NEET women. In
this study, we will initially present an overview of the socio-demographic,
cultural and economic situation of EI young women and unemployed young
men by NEET status since these categories represent the most homogenous
and the biggest parts of our main sub-populations, in order to extract the
variables that will help us discover how some factors affect differently the
likelihood of young men and women becoming NEET using logistic
regression. Lastly, we will attempt to discuss the need of a new indicator to
complement the NEET rate as a measuring tool of the achievement of
sustainable development goals.
NB: It is important to note that in this study the terms “youth” and “young”
refers to the population aged from 15 to 29 years old.
2. Methodology
To make detecting the key factors that affect the likelihood of becoming
NEET for young men and women easier, we will start by displaying the profile
of the EI young women and the unemployed young men, since these two
categories correspond to the largest parts of NEET population (cf. Figure.1).
Then we will run two logistic regression analyses to find the similarities and
disparities regarding factors that increase the possibility of falling in the NEET
population for young men and women (NB : only the young women model
will be displayed generously (methodology and SPSS output in Table.2)).
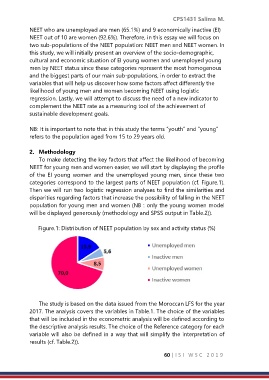
Figure.1: Distribution of NEET population by sex and activity status (%)
The study is based on the data issued from the Moroccan LFS for the year
2017. The analysis covers the variables in Table.1. The choice of the variables
that will be included in the econometric analysis will be defined according to
the descriptive analysis results. The choice of the Reference category for each
variable will also be defined in a way that will simplify the interpretation of
results (cf. Table.2)).
60 | I S I W S C 2 0 1 9