
Page 112 - Contributed Paper Session (CPS) - Volume 4
P. 112
CPS2135 Sumonkanti Das et al.
of sex-ageclass-motive-mode. For illustration, only one figure has been shown
to illustrate the model performance. The plots at the first row of Figure 2 show
examples of structural zeros, the plots of second draw indicate how the “V
2009” component captures the 2009 outliers, the plots of third row show the
effect of br ovin break variable and those of fourth row indicate combination
of these two effects. It is also noted that the horseshoe prior for “V 2009”
provides very small effects for most domains but very large for some domains.
4. Discussion and Conclusion
The purpose of the paper was to develop a suitable time series model for
predicting the average number of journey parts pppd based on the time-series
data of 1999-2017 accounting for the two redesigns and the influence of the
2009 outliers along with the problem of unstable standard errors of direct
estimates. The GVF model has been developed to obtain smooth estimates of
the standard errors, used as input in time series model development. The final
time series model consists of fixed effects as well as several random
components which account for the discontinuities, 2009 outlier effects,
smooth trend components at two lower aggregation levels, and white noise
at the most detailed level. In addition, global-local priors have been
incorporated in the distribution of the “V 2009” and “V BR” random
components. By construction, the fitted model provides numerically consistent
predictions at all aggregation levels. The study shows the fitted model at the
most detailed level can be used to produce reliable estimates at the higher
aggregation levels. Though the input estimates are assumed independent in
this study, their correlations will be incorporated in the model development in
further studies.
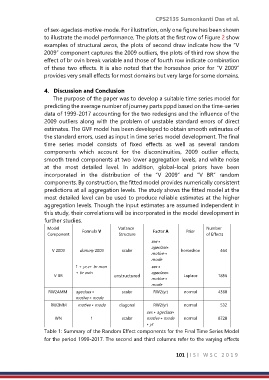
Model Variance Number
Component Formula V Structure Factor A Prior of Effects
sex ∗
ageclass∗
V 2009 dummy 2009 scalar horseshoe 464
motive ∗
mode
1 + yr.c+ br mon sex ∗
+ br ovin ageclass∗
V BR unstructured Laplace 1856
motive ∗
mode
RW2AMM ageclass ∗ scalar RW2(yr) normal 4360
motive ∗ mode
RW2MM motive ∗ mode diagonal RW2(yr) normal 532
sex ∗ ageclass∗
WN 1 scalar motive ∗ mode normal 8720
∗ yr
Table 1: Summary of the Random Effect components for the Final Time Series Model
for the period 1999-2017. The second and third columns refer to the varying effects
101 | I S I W S C 2 0 1 9