
Page 151 - Contributed Paper Session (CPS) - Volume 4
P. 151
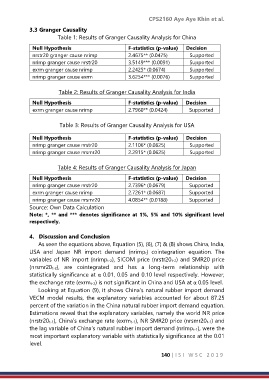
CPS2160 Aye Aye Khin et al.
            3.3 Granger Causality
                       Table 1: Results of Granger Causality Analysis for China

             Null Hypothesis                      F-statistics (p-value)   Decision
             nrstr20 granger cause nrimp          2.4675** (0.0475)       Supported
             nrimp granger cause nrstr20          3.5149*** (0.0091)      Supported
             exrm granger cause nrimp             2.2425* (0.0674)        Supported
             nrimp granger cause exrm             3.6254*** (0.0076)      Supported

                        Table 2: Results of Granger Causality Analysis for India

             Null Hypothesis                      F-statistics (p-value)   Decision
             exrm granger cause nrimp             2.7960** (0.0424)       Supported

                        Table 3: Results of Granger Causality Analysis for USA

             Null Hypothesis                      F-statistics (p-value)   Decision
             nrimp granger cause nrstr20          2.1106* (0.0825)        Supported
             nrimp granger cause nrsmr20          2.2915* (0.0625)        Supported

                       Table 4: Results of Granger Causality Analysis for Japan

             Null Hypothesis                      F-statistics (p-value)   Decision
             nrimp granger cause nrstr20          2.7396* (0.0679)        Supported
             exrm granger cause nrimp             2.7261* (0.0687)        Supported
             nrimp granger cause nrsmr20          4.0854** (0.0188)       Supported
            Source: Own Data Calculation
            Note:  *,  **  and  ***  denotes  significance  at  1%,  5%  and  10%  significant  level
            respectively.

            4.  Discussion and Conclusion
                As seen the equations above, Equation (5), (6), (7) & (8) shows China, India,
            USA  and  Japan  NR  import  demand  (nrimpt)  cointegration  equation.  The
            variables of NR import (nrimpt-2), SICOM price (nrstr20t-2) and SMR20 price
            (nrsmr20t-2),  are  cointegrated  and  has  a  long-term  relationship  with
            statistically significance at α 0.01, 0.05 and 0.10 level respectively. However,
            the exchange rate (exrmt-2) is not significant in China and USA at α 0.05 level.
                Looking at Equation (9), it shows China’s natural rubber import demand
            VECM  model  results,  the  explanatory  variables  accounted  for  about  87.25
            percent of the variation in the China natural rubber import demand equation.
            Estimations reveal that the explanatory variables, namely the world NR price
            (nrstr20t-1), China’s exchange rate (exrmt-1), NR SMR20 price (nrsmr20t-1) and
            the lag variable of China’s natural rubber import demand (nrimpt-1), were the
            most important explanatory variable with statistically significance at the 0.01
            level.

                                                               140 | I S I   W S C   2 0 1 9