
Page 210 - Contributed Paper Session (CPS) - Volume 4
P. 210
CPS2182 Lynne Billard et al.
Data II: clustered by K-means method (City Data II: clustered by K-means method Data II: K-regression clustering, final
Block distance) (Hausdorff distance) (iteration9)
Figure 4(a) Figure 4(b) Figure 4(c)
2.3 Different Data Structures
Let us now see how well the k-regressions method performs on the
following three data sets with respective structures:
(1) = 1.0 + 1.3 (1) = 142 + 5 (1) = 2.0 + 0.8
(2) = 45 + 1.8 (2) = 33 − 3 (2) = 1.0 + 2.3
(3) = 45 − 2.5 (3) = −73 + 0.6 (3) = 3.0 − 1.8
(4) = 1.0 + 4.3
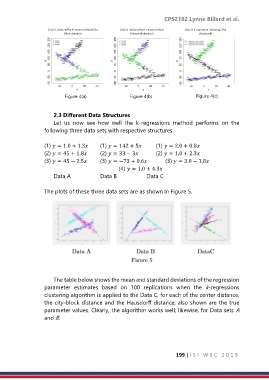
Data A Data B Data C
The plots of these three data sets are as shown in Figure 5.
The table below shows the mean and standard deviations of the regression
parameter estimates based on 100 replications when the k-regressions
clustering algorithm is applied to the Data C, for each of the center distance,
the city-block distance and the Hausdorff distance; also shown are the true
parameter values. Clearly, the algorithm works well; likewise, for Data sets A
and B.
199 | I S I W S C 2 0 1 9