
Page 209 - Contributed Paper Session (CPS) - Volume 4
P. 209
CPS2182 Lynne Billard et al.
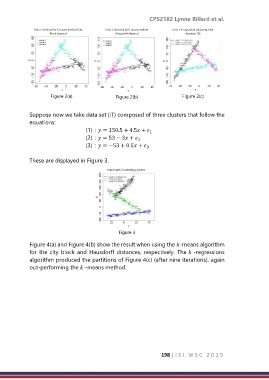
Data I: clustered by K-means method (City Data I: clustered by K-means method Data I: K-regression clustering, final
Block distance) (Hausdorff distance) (iteration 10)
Figure 2(a) Figure 2(b) Figure 2(c)
Suppose now we take data set (IT) composed of three clusters that follow the
equations:
(1) : = 150.5 + 4.5 +
1
(2) : = 53 − 3 +
2
(3) : = −53 + 0.5 +
3
These are displayed in Figure 3.
Data II with 3 underlying clusters
Figure 3
Figure 4(a) and Figure 4(b) show the result when using the -means algorithm
for the city block and Hausdorff distances, respectively. The -regressions
algorithm produced the partitions of Figure 4(c) (after nine iterations), again
out-performing the -means method.
198 | I S I W S C 2 0 1 9