
Page 428 - Contributed Paper Session (CPS) - Volume 4
P. 428
CPS2509 D.L Sepato et al.
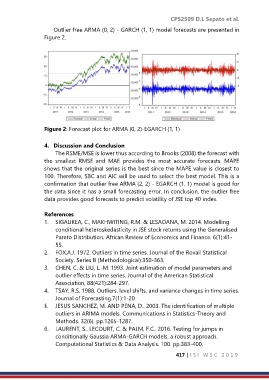
Outlier free ARMA (0, 2) - GARCH (1, 1) model forecasts are presented in
Figure 2.
Figure 2: Forecast plot for ARMA (0, 2)-EGARCH (1, 1)
4. Discussion and Conclusion
The RSME/MSE is lower thus according to Brooks (2008) the forecast with
the smallest RMSE and MAE provides the most accurate forecasts. MAPE
shows that the original series is the best since the MAPE value is closest to
100. Therefore, SBC and AIC will be used to select the best model. This is a
confirmation that outlier free ARMA (2, 2) - EGARCH (1, 1) model is good for
the data since it has a small forecasting error. In conclusion, the outlier free
data provides good forecasts to predict volatility of JSE top 40 index.
References
1. SIGAUKEA, C., MAKHWITING, R.M. & LESAOANA, M. 2014. Modelling
conditional heteroskedasticity in JSE stock returns using the Generalised
Pareto Distribution. African Review of Economics and Finance. 6(1):41-
55.
2. FOX,A.J. 1972. Outliers in time series. Journal of the Rovail Statistical
Society. Series B (Methodological):350-363.
3. CHEN, C. & LIU, L.-M. 1993. Joint estimation of model parameters and
outlier effects in time series. Journal of the American Statistical
Association, 88(421):284-297.
4. TSAY, R.S. 1988. Outliers. level shifts. and variance changes in time series.
Journal of Forecasting.7(1):1-20
§. JESUS SANCHEZ, M. AND PENA, D.. 2003. The identification of multiple
outliers in ARIMA models. Communications in Statistics-Theory and
Methods. 32(6). pp.1265-1287.
6. LAURENT, S., LECOURT, C. & PALM, F.C.. 2016. Testing for jumps in
conditionally Gaussia ARMA-GARCH models. a robust approach.
Computational Statistics & Data Analysis. 100. pp.383-400.
417 | I S I W S C 2 0 1 9