
Page 425 - Contributed Paper Session (CPS) - Volume 4
P. 425
CPS2509 D.L Sepato et al.
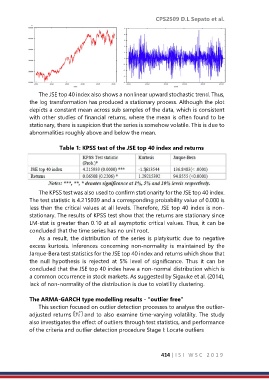
The JSE top 40 index also shows a nonlinear upward stochastic trend. Thus,
the log transformation has produced a stationary process. Although the plot
depicts a constant mean across sub samples of the data, which is consistent
with other studies of financial returns, where the mean is often found to be
stationary, there is suspicion that the series is somehow volatile. This is due to
abnormalities roughly above and below the mean.
Table 1: KPSS test of the JSE top 40 index and returns
The KPSS test was also used to confirm stationarity for the JSE top 40 index.
The test statistic is 4.215939 and a corresponding probability value of 0.000 is
less than the critical values at all levels. Therefore, JSE top 40 index is non-
stationary. The results of KPSS test show that the returns are stationary since
LM-stat is greater than 0.10 at all asymptotic critical values. Thus, it can be
concluded that the time series has no unit root.
As a result, the distribution of the series is platykurtic due to negative
excess kurtosis. Inferences concerning non-normality is maintained by the
Jarque-Bera test statistics for the JSE top 40 index and returns which show that
the null hypothesis is rejected at 5% level of significance. Thus it can be
concluded that the JSE top 40 index have a non-normal distribution which is
a common occurrence in stock markets. As suggested by Sigauke et al. (2014),
lack of non-normality of the distribution is due to volatility clustering.
The ARMA-GARCH type modelling results - “outlier free”
This section focused on outlier detection processes to analyse the outlier-
adjusted returns and to also examine time-varying volatility. The study
also investigates the effect of outliers through test statistics, and performance
of the criteria and outlier detection procedure Stage I: Locate outliers
414 | I S I W S C 2 0 1 9