
Page 426 - Contributed Paper Session (CPS) - Volume 4
P. 426
CPS2509 D.L Sepato et al.
Table 2 shows the maximum number of outliers found is 99 at 1% level of
significance under the tests of hypothesis. There are two types of outliers
detected namely the AO and LS at 0.01 level of significance as shown in Table
3 (e.g. = 991 = = 18/12/2014, = 4.5309) . Therefore = 99, with
a threshold critical value of = 3.5. Following the Chen and Liu (1993)
procedure, outliers are detected through inner and outer loops indicated in
Table 4 (Appendix). Iterations around the function locate outliers until no
additional outliers are found or the maximum number of iterations is reached.
After each iteration, the effect of the outliers on the residuals of the fitted
model is removed and the t-statistics are obtained again for the modified
residuals. No model selection or refit of the model is conducted within this
loop. At the end of each iteration, the detected outliers are removed from the
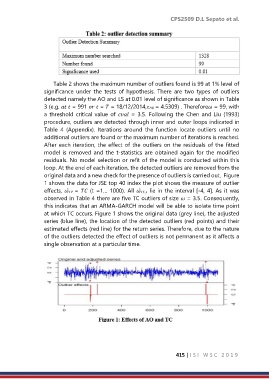
original data and a new check for the presence of outliers is carried out. Figure
1 shows the data for JSE top 40 index the plot shows the measure of outlier
effects, = (t =1… 1000). All , lie in the interval [-4, 4]. As it was
observed in Table 4 there are five TC outliers of size = 3.5. Consequently,
this indicates that an ARMA-GARCH model will be able to isolate time point
at which TC occurs. Figure 1 shows the original data (grey line), the adjusted
series (blue line), the location of the detected outliers (red points) and their
estimated effects (red line) for the return series. Therefore, due to the nature
of the outliers detected the effect of outliers is not permanent as it affects a
single observation at a particular time.
415 | I S I W S C 2 0 1 9