
Page 45 - Contributed Paper Session (CPS) - Volume 4
P. 45
CPS2111 Grant J. Cameron et al.
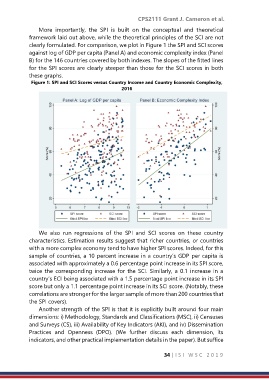
More importantly, the SPI is built on the conceptual and theoretical
framework laid out above, while the theoretical principles of the SCI are not
clearly formulated. For comparison, we plot in Figure 1 the SPI and SCI scores
against log of GDP per capita (Panel A) and economic complexity index (Panel
B) for the 146 countries covered by both indexes. The slopes of the fitted lines
for the SPI scores are clearly steeper than those for the SCI scores in both
these graphs.
Figure 1: SPI and SCI Scores versus Country Income and Country Economic Complexity,
2016
We also run regressions of the SPI and SCI scores on these country
characteristics. Estimation results suggest that richer countries, or countries
with a more complex economy tend to have higher SPI scores. Indeed, for this
sample of countries, a 10 percent increase in a country’s GDP per capita is
associated with approximately a 0.6 percentage point increase in its SPI score,
twice the corresponding increase for the SCI. Similarly, a 0.1 increase in a
country’s ECI being associated with a 1.5 percentage point increase in its SPI
score but only a 1.1 percentage point increase in its SCI score. (Notably, these
correlations are stronger for the larger sample of more than 200 countries that
the SPI covers).
Another strength of the SPI is that it is explicitly built around four main
dimensions: i) Methodology, Standards and Classifications (MSC), ii) Censuses
and Surveys (CS), iii) Availability of Key Indicators (AKI), and iv) Dissemination
Practices and Openness (DPO). (We further discuss each dimension, its
indicators, and other practical implementation details in the paper). But suffice
34 | I S I W S C 2 0 1 9