
Page 46 - Contributed Paper Session (CPS) - Volume 4
P. 46
CPS2111 Grant J. Cameron et al.
it now to examine a disaggregation of the scores by regions in all four
dimensions, which can help us disentangle which dimensions drive these
differences and can be improved.
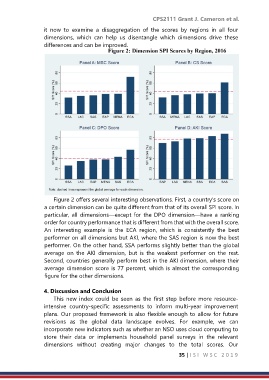
Figure 2 offers several interesting observations. First, a country’s score on
a certain dimension can be quite different from that of its overall SPI score. In
particular, all dimensions—except for the DPO dimension—have a ranking
order for country performance that is different from that with the overall score.
An interesting example is the ECA region, which is consistently the best
performer on all dimensions but AKI, where the SAS region is now the best
performer. On the other hand, SSA performs slightly better than the global
average on the AKI dimension, but is the weakest performer on the rest.
Second, countries generally perform best in the AKI dimension, where their
average dimension score is 77 percent, which is almost the corresponding
figure for the other dimensions.
4. Discussion and Conclusion
This new index could be seen as the first step before more resource-
intensive country-specific assessments to inform multi-year improvement
plans. Our proposed framework is also flexible enough to allow for future
revisions as the global data landscape evolves. For example, we can
incorporate new indicators such as whether an NSO uses cloud computing to
store their data or implements household panel surveys in the relevant
dimensions without creating major changes to the total scores. Our
35 | I S I W S C 2 0 1 9