
Page 53 - Contributed Paper Session (CPS) - Volume 4
P. 53
CPS2119 Noor Azlin M. S. et al.
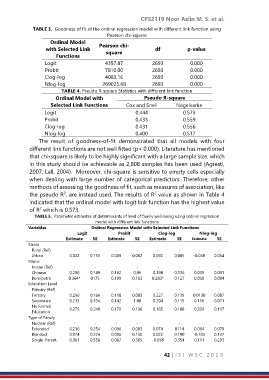
TABLE 3. Goodness of fit of the ordinal regression model with different link function using
Pearson chi-square
Ordinal Model
with Selected Link Pearson chi- df p-value
square
Functions
Logit 4357.87 2693 0.000
Probit 7810.00 2693 0.000
Clog-log 4083.16 2693 0.000
Nlog-log 269025.68 2693 0.000
TABLE 4. Pseudo R-square Statistics with different link function
Ordinal Model with Pseudo R-square
Selected Link Functions Cox and Snell Nagelkerke
Logit 0.444 0.573
Probit 0.433 0.559
Clog-log 0.431 0.556
Nlog-log 0.400 0.517
The result of goodness-of-fit demonstrated that all models with four
different link functions are not well fitted (p< 0.000). Literature has mentioned
that chi-square is likely to be highly significant with a large sample size, which
in this study should be achievable as 2,808 samples has been used (Agresti,
2007; Lall, 2004). Moreover, chi-square is sensitive to empty cells especially
when dealing with large number of categorical predictors. Therefore, other
methods of assessing the goodness of fit, such as measures of association, like
2
2
the pseudo R , are instead used. The results of R value as shown in Table 4
indicated that the ordinal model with logit link function has the highest value
2
of R which is 0.573.
TABLE 5. Parameter estimates of determinants of level of family well-being using ordinal regression
model with different link functions
Variables Ordinal Regression Model with Selected Link Functions
Logit Probit Clog-log Nlog-log
Estimate SE Estimate SE Estimate SE Estimate SE
Strata
Rural (Ref) - - - - - - - -
Urban 0.032 0.155 0.009 0.062 0.092 0.085 -0.038 0.054
Ethnic
Indian (Ref) - - - - - - - -
Chinese 0.296 0.189 0.162 0.95 0.198 0.136 0.039 0.091
Bumiputra 0.364* 0175 0.199 0.103 0.283* 0.127 0.050 0.084
Education Level
Primary (Ref) - - - - - - - -
Tertiary 0.256 0.186 0.118 0.083 0.227 0.135 0.0130 0.087
Secondary 0.213 0.354 0.142 1.00 0.204 0.115 0.116 0.071
No Formal
Education 0.275 0.248 0.172 0.136 0.185 0.188 0.339 0.117
Type of Family
Nuclear (Ref) - - - - - - - -
Extended 0.216 0.254 0.096 0.083 0.074 0114 0.064 0.070
Blended 0.074 0.274 0.006 0.150 0.022 0.190 -0.105 0.137
Single-Parent 0.061 0.558 0.067 0.305 -0.058 0.354 0.111 0.293
42 | I S I W S C 2 0 1 9