
Page 54 - Contributed Paper Session (CPS) - Volume 4
P. 54
CPS2119 Noor Azlin M. S. et al.
Variables Ordinal Regression Model with Selected Link Functions
Logit Probit Clog-log Nlog-log
Estimate SE Estimate SE Estimate SE Estimate SE
Household
Income
≤RM2000 (Ref) - - - - - - - -
RM2001- -0.040 0.136 0.027 0.074 0.173 0.193 0.039 0.116
RM4000
RM4001-
RM7000 -0.037 0.191 -0.017 0.103 0.107 0.136 -0.008 0.088
>RM7000 0.252 0.261 0.114 0.139 0.083 0.099 -0.028 0.064
Family
Relationship
Low (Ref) - - - - - - - -
Moderate 1.085*** 0.228 0.556*** 0.130 0.411*** 0.153 0.650*** 0.147
High 2.462*** 0.233 1.294*** 0.132 1.459*** 0.156 1.189*** 0.145
Economic
Situation
Low (Ref) - - - - - - - -
Moderate 0.481** 0.158 0.253** 0.089 0.269 0.114 0.245* 0.085
High 1.152** 0.172 0.635** 0.095 0.807* 0.135 0.538* 0.087
Health
Low (Ref) - -
Moderate 0.441* 0.200 0.218* 0.133 0.414* 0.153 0.123 0.113
High 0.508
0.940* 0.276* 0.120 0.718* 0.157 0.401* 0.115
*
Safety
Low (Ref) - - - - - - - -
Moderate 0.040 0.231 0.049 0.131 -0.108 0.159 0.199 0.132
High 0.529* 0.240 0.276* 0.130 0.299 0.173 0.322* 0.134
Community
Relationship
Low (Ref) - - - - - - - -
Moderate 0.381** 0.208 0.183 0117 0.164 0.142 0.174 0.116
High 0.620** 0.225 0.323* 0.124 0.359* 0.164 0.282* 0.120
Religion Practice
Low (Ref) - - - - - - - -
Moderate 0.492* 0.199 0.261* 0112 0.181 0.135 0.304 0.114
High 1.139* 0.214 0.667* 0.121 0.709* 0.155 0.563* 0.118
Housing and
Environment
Low (Ref) - - - - - - - -
Moderate 0.070 0.167 0.008 0.093 -0.020 0.118 0.069 0.089
High 0.630* 0.183 0.391* 1.00 0.585* 0.140 0.376* 0.089
Intercept 1 1.451*** 0.284 0.757*** 0.159 0.048*** 0.197 1.249*** 0.174
(Low|Moderate)
Intercept 2
(Moderate|High) 4.914*** 0.319 2.565*** 0.172 2.445*** 0.212 2.732*** 0.187
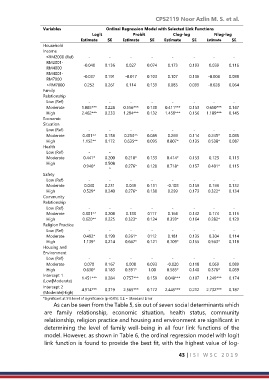
*Significant at 5% level of significance (p<0.05); S.E = Standard Error
As can be seen from the Table 5, six out of seven social determinants which
are family relationship, economic situation, health status, community
relationship, religion practice and housing and environment are significant in
determining the level of family well-being in all four link functions of the
model. However, as shown in Table 6, the ordinal regression model with logit
link function is found to provide the best fit, with the highest value of log-
43 | I S I W S C 2 0 1 9