
Page 51 - Contributed Paper Session (CPS) - Volume 4
P. 51
CPS2119 Noor Azlin M. S. et al.
explanatory variables is described through c-1 logits denoted as g_1 (Χ),g_2
(Χ),…,g_(c-1) (Χ), which relate a set of intercepts (α_s) and regression
coefficients (β_s) to the probability of the response levels. The [exp (β_s)] is
interpreted as the odds ratio for a one-unit increase in the given explanatory
variable, which is a measure used for comparing two response levels or two
sets of response levels.
In particular, there is no clear-cut procedure on how to choose the
appropriate link-function to analyse the ordinal regression model (Christensen
2015). Accordingly, the main objective of this study is to employ the ordinal
regression model with different link functions for modelling the relationship
between level of family well-being and demographic, socioeconomic and
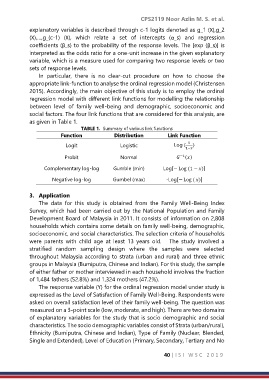
social factors. The four link functions that are considered for this analysis, are
as given in Table 1.
TABLE 1. Summary of various link functions
Function Distribution Link Function
Logit Logistic Log ( )
1−
Probit Normal −1 ()
Complementary log-log Gumble (min) Log[− Log (1 − )]
Negative log-log Gumbel (max) -Log[− Log ( )]
3. Application
The data for this study is obtained from the Family Well-Being Index
Survey, which had been carried out by the National Population and Family
Development Board of Malaysia in 2011. It consists of information on 2,808
households which contains some details on family well-being, demographic,
socioeconomic, and social characteristics. The selection criteria of households
were parents with child age at least 13 years old. The study involved a
stratified random sampling design where the samples were selected
throughout Malaysia according to strata (urban and rural) and three ethnic
groups in Malaysia (Bumiputra, Chinese and Indian). For this study, the sample
of either father or mother interviewed in each household involves the fraction
of 1,484 fathers (52.8%) and 1,324 mothers (47.2%).
The response variable (Y) for the ordinal regression model under study is
expressed as the Level of Satisfaction of Family Well-Being. Respondents were
asked on overall satisfaction level of their family well-being. The question was
measured on a 3-point scale (low, moderate, and high). There are two domains
of explanatory variables for the study that is socio demographic and social
characteristics. The socio demographic variables consist of Strata (urban/rural),
Ethnicity (Bumiputra, Chinese and Indian), Type of Family (Nuclear, Blended,
Single and Extended), Level of Education (Primary, Secondary, Tertiary and No
40 | I S I W S C 2 0 1 9