
Page 77 - Contributed Paper Session (CPS) - Volume 4
P. 77
CPS2129 Matilde Bini et al.
Italian firms over the period 2008-2017. Data were preventively checked and
controlled according to the following steps: longitudinality check: only firms
with at least 5 presences in the period were considered; coherency check: all
firms with fake values (i.e. negative sales, and so on) were eliminated. Data of
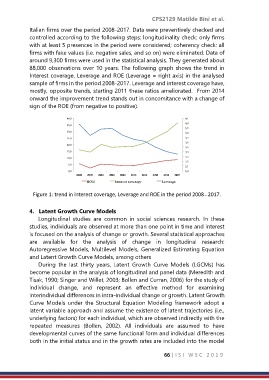
around 9,300 firms were used in the statistical analysis. They generated about
88,000 observations over 10 years. The following graph shows the trend in
Interest coverage, Leverage and ROE (Leverage = right axis) in the analysed
sample of firms in the period 2008-2017. Leverage and interest coverage have,
mostly, opposite trends, starting 2011 these ratios ameliorated. From 2014
onward the improvement trend stands out in concomitance with a change of
sign of the ROE (from negative to positive).
40 , 0 4 , 1
35 , 0 4 0 , 9
3 ,
30 , 0 3 8 ,
25 , 0 3 , 7
6
,
20 , 0 3 3 , 5
15 , 0 3 , 4
10 0 , 3 , 3
5 , 0 3 , 2
3 , 1
0 , 0 3 0 ,
2008 2009 2010 2011 2012 2013 2014 2015 2016 2017
ROE Interest coverage Leverage
Figure 1: trend in Interest coverage, Leverage and ROE in the period 2008−2017.
4. Latent Growth Curve Models
Longitudinal studies are common in social sciences research. In these
studies, individuals are observed at more than one point in time and interest
is focused on the analysis of change or growth. Several statistical approaches
are available for the analysis of change in longitudinal research:
Autoregressive Models, Multilevel Models, Generalized Estimating Equation
and Latent Growth Curve Models, among others
During the last thirty years, Latent Growth Curve Models (LGCMs) has
become popular in the analysis of longitudinal and panel data (Meredith and
Tisak, 1990; Singer and Willet, 2003; Bollen and Curran, 2006) for the study of
individual change, and represent an effective method for examining
interindividual differences in intra-individual change or growth. Latent Growth
Curve Models under the Structural Equation Modeling framework adopt a
latent variable approach and assume the existence of latent trajectories (i.e.,
underlying factors) for each individual, which are observed indirectly with the
repeated measures (Bollen, 2002). All individuals are assumed to have
developmental curves of the same functional form and individual differences
both in the initial status and in the growth rates are included into the model
66 | I S I W S C 2 0 1 9