
Page 108 - Contributed Paper Session (CPS) - Volume 7
P. 108
CPS2042 Anna Christine D. et al.
navigation device, and (ii) modified track data where plot boundaries were
8
digitized on Google Earth Pro. A GIS software named QGIS was used for data
processing.
3. Results
Two sets of weights were calculated for the sample subplots based on each
9
source of area measurement—unmodified and modified data. These weights
were used to produce alternative direct estimates of the total area planted in
rice alongside calculating corresponding SE, 95% confidence intervals and
design effects.
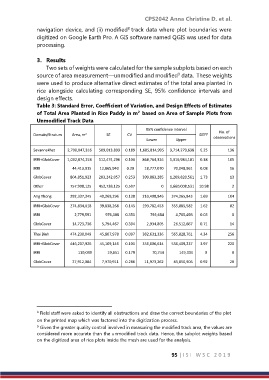
Table 3: Standard Error, Coefficient of Variation, and Design Effects of Estimates
of Total Area Planted in Rice Paddy in m based on Area of Sample Plots from
2
Unmodified Track Data
95% confidence interval
Domain/Stratum Area, m 2 SE CV DEFF No. of
Lower Upper observations
Savannakhet 2,700,047,316 509,013,893 0.189 1,685,814,995 3,714,279,638 6.25 136
IRRI+GlobCover 1,092,874,253 112,474,296 0.103 868,764,326 1,316,984,181 0.38 105
IRRI 44,413,015 12,865,940 0.29 18,777,070 70,048,961 0.08 16
GlobCover 804,851,923 203,242,057 0.253 399,883,285 1,209,820,561 1.73 13
Other 757,908,125 452,738,125 0.597 0 1,660,008,531 10.98 2
Ang Thong 292,337,345 40,269,296 0.138 210,408,846 374,265,843 1.69 104
IRRI+GlobCover 274,834,018 39,838,268 0.145 193,782,453 355,885,582 1.62 82
IRRI 2,779,591 976,108 0.351 793,684 4,765,498 0.03 8
GlobCover 14,723,736 5,794,467 0.394 2,934,805 26,512,667 0.71 14
Thai Binh 474,230,049 45,807,978 0.097 382,631,336 565,828,761 4.34 256
IRRI+GlobCover 446,207,926 45,109,146 0.101 356,006,614 536,409,237 3.97 220
IRRI 110,039 19,651 0.179 70,744 149,334 0 8
GlobCover 27,912,084 7,970,911 0.286 11,973,262 43,850,906 0.92 28
8 Field staff were asked to identify all obstructions and draw the correct boundaries of the plot
on the printed map which was factored into the digitization process.
9 Given the greater quality control involved in measuring the modified track area, the values are
considered more accurate than the unmodified track data. Hence, the subplot weights based
on the digitized area of rice plots inside the mesh are used for the analysis.
95 | I S I W S C 2 0 1 9