
Page 111 - Contributed Paper Session (CPS) - Volume 7
P. 111
CPS2042 Anna Christine D. et al.
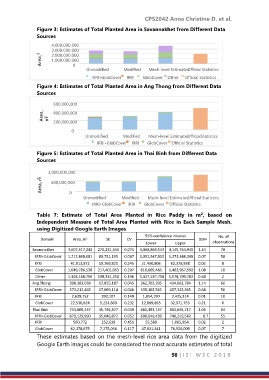
Figure 3: Estimates of Total Planted Area in Savannakhet from Different Data
Sources
4,000,000,000
3,000,000,000
2,000,000,000
1,000,000,000
0
Unmodified Modified Mesh-level Estimates Official Statistics
IRRI+GlobCover IRRI GlobCover Other Official Statistics
Figure 4: Estimates of Total Planted Area in Ang Thong from Different Data
Sources
600,000,000
400,000,000
200,000,000
0
Unmodified Modified Mesh-level Estimates OfficialStatistics
IRRI+GlobCover IRRI GlobCover Official Statistics
Figure 5: Estimates of Total Planted Area in Thai Binh from Different Data
Sources
1,000,000,000
500,000,000
0
Unmodified Modified Mesh-level Estimates Official Statistics
IRRI+GlobCover IRRI GlobCover Official Statistics
Table 7: Estimate of Total Area Planted in Rice Paddy in m , based on
2
Independent Measure of Total Area Planted with Rice in Each Sample Mesh,
using Digitized Google Earth Images
95% confidence interval No. of
Domain Area, m 2 SE CV DEFF
Lower Upper observations
Savannakhet 3,607,317,242 270,231,340 0.075 3,068,869,543 4,145,764,940 1.24 78
IRRI+GlobCover 1,212,448,081 80,751,195 0.067 1,051,547,813 1,373,348,348 0.07 58
IRRI 41,913,872 10,269,821 0.245 21,450,806 62,376,938 0.02 8
GlobCover 1,049,786,538 217,401,053 0.207 616,605,485 1,482,967,592 1.08 10
Other 1,303,168,750 138,331,250 0.106 1,027,537,718 1,578,799,782 0.68 2
Ang Thong 398,383,039 17,855,187 0.045 362,702,295 434,063,784 1.14 66
IRRI+GlobCover 373,212,463 17,069,114 0.046 339,102,562 407,322,365 0.68 50
IRRI 2,639,752 393,107 0.149 1,854,190 3,425,314 0.01 10
GlobCover 22,530,824 5,224,800 0.232 12,089,895 32,971,753 0.21 6
Thai Binh 733,069,437 35,794,877 0.049 661,493,157 804,645,717 1.05 64
IRRI+GlobCover 670,129,990 35,046,872 0.052 600,049,439 740,210,542 0.7 55
IRRI 560,772 252,639 0.451 55,589 1,065,954 0.02 2
GlobCover 62,378,675 7,275,036 0.117 47,831,341 76,926,009 0.07 7
These estimates based on the mesh-level rice area data from the digitized
Google Earth images could be considered the most accurate estimates of total
98 | I S I W S C 2 0 1 9