
Page 109 - Contributed Paper Session (CPS) - Volume 7
P. 109
CPS2042 Anna Christine D. et al.
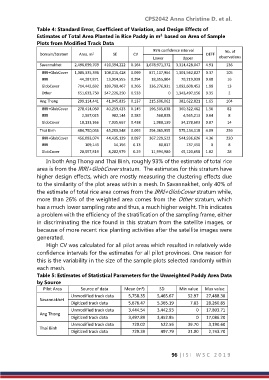
Table 4: Standard Error, Coefficient of Variation, and Design Effects of
Estimates of Total Area Planted in Rice Paddy in m based on Area of Sample
2
Plots from Modified Track Data
95% confidence interval No. of
Domain/Stratum Area, m 2 SE CV DEFF
Lower Upper observations
Savannakhet 2,496,699,709 410,394,222 0.164 1,678,971,372 3,314,428,047 4.91 136
IRRI+GlobCover 1,086,335,396 108,016,428 0.099 871,107,964 1,301,562,827 0.37 105
IRRI 44,287,871 13,014,555 0.294 18,355,804 70,219,939 0.08 16
GlobCover 714,442,692 189,790,467 0.266 336,276,931 1,092,608,453 1.98 13
Other 651,633,750 347,226,250 0.533 0 1,343,497,156 9.35 2
Ang Thong 299,114,441 41,045,835 0.137 215,606,062 382,622,821 1.65 104
IRRI+GlobCover 278,414,050 40,259,423 0.145 196,505,638 360,322,462 1.56 82
IRRI 2,567,025 982,144 0.383 568,838 4,565,213 0.04 8
GlobCover 18,133,366 7,935,667 0.438 1,988,130 34,278,603 0.87 14
Thai Binh 484,750,036 45,200,548 0.093 394,365,955 575,134,118 4.89 256
IRRI+GlobCover 456,083,074 44,435,139 0.097 367,229,522 544,936,626 4.36 220
IRRI 109,143 14,156 0.13 80,837 137,450 0 8
GlobCover 28,557,819 8,282,979 0.29 11,994,980 45,120,658 1.02 28
In both Ang Thong and Thai Binh, roughly 93% of the estimate of total rice
area is from the IRRI+GlobCover stratum. The estimates for this stratum have
higher design effects, which are mostly measuring the clustering effects due
to the similarity of the plot areas within a mesh. In Savannakhet, only 40% of
the estimate of total rice area comes from the IRRI+GlobCover stratum while,
more than 26% of the weighted area comes from the Other stratum, which
has a much lower sampling rate and thus, a much higher weight. This indicates
a problem with the efficiency of the stratification of the sampling frame, either
in discriminating the rice found in this stratum from the satellite images, or
because of more recent rice planting activities after the satellite images were
generated.
High CV was calculated for all pilot areas which resulted in relatively wide
confidence intervals for the estimates for all pilot provinces. One reason for
this is the variability in the size of the sample plots selected randomly within
each mesh.
Table 5: Estimates of Statistical Parameters for the Unweighted Paddy Area Data
by Source
Pilot Area Source of data Mean (m ) SD Min value Max value
2
Unmodified track data 5,758.35 5,465.67 52.97 27,488.38
Savannakhet
Digitized track data 5,676.47 5,365.19 7.83 28,260.85
Unmodified track data 3,444.54 3,442.93 0 17,803.71
Ang Thong
Digitized track data 3,497.89 3,452.85 0 17,086.20
Unmodified track data 720.02 522.56 39.70 3,190.60
Thai Binh
Digitized track data 729.39 497.79 31.00 2,743.70
96 | I S I W S C 2 0 1 9