
Page 110 - Contributed Paper Session (CPS) - Volume 7
P. 110
CPS2042 Anna Christine D. et al.
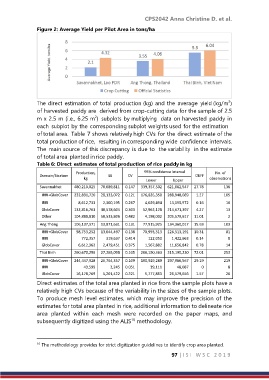
Figure 2: Average Yield per Pilot Area in tons/ha
The direct estimation of total production (kg) and the average yield (kg/m )
2
of harvested paddy are derived from crop-cutting data for the sample of 2.5
m x 2.5 m (i.e., 6.25 m ) subplots by multiplying data on harvested paddy in
2
each subplot by the corresponding subplot weights used for the estimation
of total area. Table 7 shows relatively high CVs for the direct estimate of the
total production of rice, resulting in corresponding wide confidence intervals.
The main source of this discrepancy is due to the variability in the estimate
of total area planted in rice paddy.
Table 6: Direct estimates of total production of rice paddy in kg
Production, 95% confidence interval No. of
Domain/Stratum SE CV DEFF
kg observations
Lower Upper
Savannakhet 480,210,025 70,689,811 0.147 339,357,502 621,062,547 27.78 136
IRRI+GlobCover 232,891,720 28,133,072 0.121 176,835,350 288,948,089 1.27 105
IRRI 8,612,733 2,300,195 0.267 4,029,494 13,195,972 0.16 16
GlobCover 133,816,763 40,578,604 0.303 52,962,128 214,671,397 4.27 13
Other 104,888,810 50,533,806 0.482 4,198,002 205,579,617 11.01 2
Ang Thong 106,137,971 13,871,631 0.131 77,915,925 134,360,017 15.63 103
IRRI+GlobCover 98,753,252 13,644,497 0.138 70,993,313 126,513,191 10.31 81
IRRI 772,357 319,637 0.414 122,050 1,422,663 0.14 8
GlobCover 6,612,362 2,479,451 0.375 1,567,882 11,656,842 0.78 14
Thai Binh 260,670,296 27,265,098 0.105 206,150,363 315,190,230 72.01 253
IRRI+GlobCover 244,447,928 26,764,357 0.109 190,929,289 297,966,567 29.19 219
IRRI 43,599 2,245 0.051 39,111 48,087 0 8
GlobCover 16,178,769 5,201,422 0.321 5,777,883 26,579,656 1.57 26
Direct estimates of the total area planted in rice from the sample plots have a
relatively high CVs because of the variability in the sizes of the sample plots.
To produce mesh level estimates, which may improve the precision of the
estimates for total area planted in rice, additional information to delineate rice
area planted within each mesh were recorded on the paper maps, and
subsequently digitized using the ALIS methodology.
10
10 The methodology provides for strict digitization guidelines to identify crop area planted.
97 | I S I W S C 2 0 1 9