
Page 255 - Contributed Paper Session (CPS) - Volume 7
P. 255
CPS2078 Manisah Othman et al.
Exhibit 3: Total production and imports Exhibit 4: Total imports of selected vegetables, 2013 -
of round cabbage, 2013 – 2017 2017
350,000 Productio
300,000 301,518 277,202 n Imports (Tonnes)
Import
s
250,000 Selected vegetables 2013 2014 2015 2016 2017
200,000 Spinach 513.9 461.8 426.2 469.5 606.4
150,000 129,148 101,258 107,708 Lady's finger 42.0 115.5 156.9 296.5 274.1
100,000 ,574 6 ,030 ,342 Chili 36,324.0 41,229.4 47,670.5 49,069.0 47,127.7
5 ,000 4 5 ,189 5 1 ,691 5 6 4 7 7 Long bean 587.9 753.7 545.6 842.0 521.6
0
- Round cabbage 45,188.7 51,691.3 56,574.1 64,029.5 107,707.6
2013 2014 2015 2016 2017 Mustard 1,333.2 4,622.5 7,032.5 6,011.2 7,709.0
Brinjal 1,595.3 5,737.5 3,886.6 4,097.3 3,493.1
Cucumberx 6,951.4 11,154.8 16,841.9 11,460.1 12,785.1
Tomato 4,156.3 5,609.1 5,987.6 2,576.6 3,618.0
3.2 Livestock
Referring to the Economic Census findings in 2016, the highest value of
the gross output is the raising, breeding & production of chicken, broiler,
followed by the production of chicken eggs and raising, breeding &
production of swine/pigs. This is in line with the highest statistics of
production of poultry meat followed by chicken/duck eggs.
SSR for chicken/duck eggs in 2017 is 113.7 per cent, which is 13.7 per cent
exceeding domestic demand, unlike mutton where SSR is low at only 10.7 per
cent. This has a direct impact on the IDR where IDR for mutton increased to
89.3 per cent compared to 87.1 per cent in 2016.
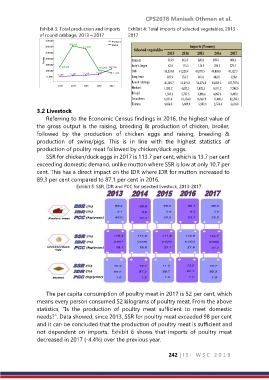
Exhibit 5: SSR, IDR and PCC for selected livestock, 2013-2017
The per capita consumption of poultry meat in 2017 is 52 per cent, which
means every person consumed 52 kilograms of poultry meat. From the above
statistics, "Is the production of poultry meat sufficient to meet domestic
needs?". Data showed, since 2013, SSR for poultry meat exceeded 98 per cent
and it can be concluded that the production of poultry meat is sufficient and
not dependent on imports. Exhibit 6 shows that imports of poultry meat
decreased in 2017 (-4.4%) over the previous year.
242 | I S I W S C 2 0 1 9