
Page 253 - Contributed Paper Session (CPS) - Volume 6
P. 253
CPS1909 Retius C. et al.
compare them with the historical VaR values (a non‐parametric approach).
For a random variable X with distribution function F over a specified time
period, the VaR (for a given probability p) can be defined as the p‐th quantile
of F, i.e., VaR = −1 (1 − ), where −1 is the quantile function (Tsay, 2013).
3. Result
In this paper, the data examined consist of the daily closing price of the all
share index (ALSI) for the period 20 May 2005 to 31 May 2016 obtained from
INET. We divide the data into in-sample dataset (20 May 2005 to 31 December
2013) and out-of-sample dataset (2 January 2014 to 31 May 2016). The in-
sample data is used for the model estimation and for forecasting risk whilst
the out-sample data is used for testing Value-at-risk (VaR) forecast. As a result,
the estimation window has 2155 observations, the testing window has 602
observations, and thus the number of observations is 2757. Investors are
interested in the return of their investment. We therefore, obtain the daily log
returns ( ) of the All Share Price Index. The log returns are given by
= ln ( )
−1
where , is the natural logarithmic return of daily price of ALSI at time , is
the daily closing price of ALSI at time and −1 is the daily closing price of
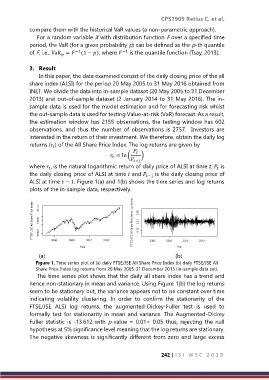
ALSI at time − 1. Figure 1(a) and 1(b) shows the time series and log returns
plots of the in-sample data, respectively.
(a) (b)
Figure 1. Time series plot of (a) daily FTSE/JSE All Share Price Index (b) daily FTSE/JSE All
Share Price Index log returns from 20 May 2005-31 December 2013 (in-sample data set).
The time series plot shows that the daily all share index has a trend and
hence non-stationary in mean and variance. Using Figure 1(b) the log returns
seem to be stationary but, the variance appears not to be constant over time
indicating volatility clustering. In order to confirm the stationarity of the
FTSE/JSE ALSI log returns, the augmented-Dickey-Fuller test is used to
formally test for stationarity in mean and variance. The Augmented-Dickey
Fuller statistic is -13.612 with p-value = 0.01< 0.05 thus, rejecting the null
hypothesis at 5% significance level meaning that the log returns are stationary.
The negative skewness is significantly different from zero and large excess
242 | I S I W S C 2 0 1 9