
Page 256 - Contributed Paper Session (CPS) - Volume 6
P. 256
CPS1909 Retius C. et al.
suggesting that the standardized residuals are skewed to the left. The AD
statistics has a p-value = 0.3248 > 0.05, confirming that the stable distribution
is a good fit for the standardized residuals.
VaR is calculated for each model and the models are backtested using
Kupiec test. The p-values of the Kupiec test for both the in-sample dataset and
out-of-sample dataset are summarized in Table 2.
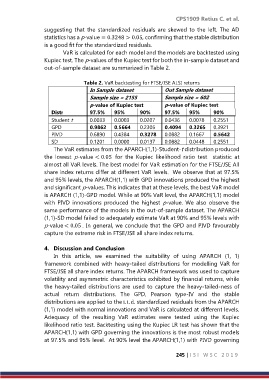
Table 2. VaR backtesting for FTSE/JSE ALSI returns
In Sample dataset Out Sample dataset
Sample size = 2155 Sample size = 602
p-value of Kupiec test p-value of Kupiec test
Distr 97.5% 95% 90% 97.5% 95% 90%
Student t 0.0033 0.0003 0.0207 0.0436 0.0078 0.2551
GPD 0.9862 0.5664 0.2306 0.4094 0.3265 0.3921
PIVD 0.6890 0.4384 0.3278 0.0882 0.1667 0.5642
SD 0.1201 0.0000 0.0137 0.0882 0.0448 0.2551
The VaR estimates from the APARCH(1,1)-Student-t distribution produced
the lowest p-value < 0.05 for the Kupiec likelihood ratio test statistic at
almost all VaR levels. The best model for VaR estimation for the FTSE/JSE All
share index returns differ at different VaR levels. We observe that at 97.5%
and 95% levels, the APARCH(1,1) with GPD innovations produced the highest
and significant p-values. This indicates that at these levels, the best VaR model
is APARCH (1,1)-GPD model. While at 90% VaR level, the APARCH(1,1) model
with PIVD innovations produced the highest p-value. We also observe the
same performance of the models in the out-of-sample dataset. The APARCH
(1,1)-SD model failed to adequately estimate VaR at 90% and 95% levels with
p-value < 0.05 . In general, we conclude that the GPD and PIVD favourably
capture the extreme risk in FTSE/JSE all share index returns.
4. Discussion and Conclusion
In this article, we examined the suitability of using APARCH (1, 1)
framework combined with heavy-tailed distributions for modelling VaR for
FTSE/JSE all share index returns. The APARCH framework was used to capture
volatility and asymmetric characteristics exhibited by financial returns, while
the heavy-tailed distributions are used to capture the heavy-tailed-ness of
actual return distributions. The GPD, Pearson type-IV and the stable
distributions are applied to the i. i. d. standardized residuals from the APARCH
(1,1) model with normal innovations and VaR is calculated at different levels.
Adequacy of the resulting VaR estimates were tested using the Kupiec
likelihood ratio test. Backtesting using the Kupiec LR test has shown that the
APARCH(1,1) with GPD governing the innovations is the most robust models
at 97.5% and 95% level. At 90% level the APARCH(1,1) with PIVD governing
245 | I S I W S C 2 0 1 9