
Page 254 - Contributed Paper Session (CPS) - Volume 6
P. 254
CPS1909 Retius C. et al.
kurtosis clearly illustrates the non-normality (asymmetric property of the log
returns) of the distribution. Since the p-value for Ljung-Box statistic is less
than 0.05, we reject the null hypothesis of no presence of serial correlation.
The p-value for the ARCH Lagrange Multiple (ARCH LM) statistic is less than
0.05. Thus we reject the null hypothesis of absence of potential time varying
volatility (no arch effect) up to lag 20. These findings led to the adoption of an
asymmetric ARCH (APARCH) model as discussed in Section 2.
Asymmetric GARCH-type model fitting
In the first step, we fit the asymmetric GARCH type models to the returns
and checks its adequacy since the returns have a significant skewness
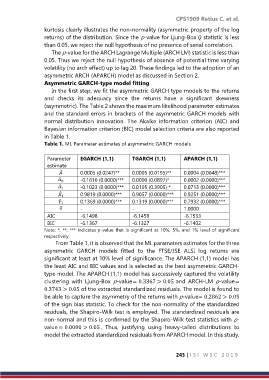
(asymmetric). The Table 2 shows the maximum likelihood parameter estimates
and the standard errors in brackets of the asymmetric GARCH models with
normal distribution innovation. The Akaike information criterion (AIC) and
Bayesian information criterion (BIC) model selection criteria are also reported
in Table 1.
Table 1. ML Parameter estimates of asymmetric GARCH models
Parameter EGARCH (1,1) TGARCH (1,1) APARCH (1,1)
estimate
̂ 0.0005 (0.0247)** 0.0005 (0.0195)** 0.0004 (0.0048)***
̂ -0.1616 (0.0000)*** 0.0000 (0.0897)* 0.0002 (0.0000)***
0
̂ -0.1023 (0.0000)*** 0.0105 (0.3905) * 0.0713 (0.0000)***
1
̂
0.9819 (0.0000)*** 0.9057 (0.0000)*** 0.9251 (0.0000)***
1
̂ 0.1369 (0.0000)*** 0.1319 (0.0000)*** 0.7932 (0.0000)***
1
- - 1.0000
AIC -6.1498 -6.1459 -6.1533
BIC -6.1367 -6.1327 -6.1402
Note: *, **, *** indicates -value that is significant at 10%, 5%, and 1% level of significant
respectively.
From Table 1, it is observed that the ML parameters estimates for the three
asymmetric GARCH models fitted to the FTSE/JSE ALSI log returns are
significant at least at 10% level of significance. The APARCH (1,1) model has
the least AIC and BIC values and is selected as the best asymmetric GARCH-
type model. The APARCH (1,1) model has successively captured the volatility
clustering with Ljung-Box p-value= 0.3367 > 0.05 and ARCH-LM p-value=
0.3743 > 0.05 of the extracted standardized residuals. The model is found to
be able to capture the asymmetry of the returns with p-value= 0.2862 > 0.05
of the sign bias statistic. To check for the non-normality of the standardized
residuals, the Shapiro-Wilk test is employed. The standardized residuals are
non-normal and this is confirmed by the Shapiro-Wilk test statistics with p-
value = 0.0000 > 0.05 . Thus, justifying using heavy-tailed distributions to
model the extracted standardized residuals from APARCH model. In this study,
243 | I S I W S C 2 0 1 9