
Page 261 - Invited Paper Session (IPS) - Volume 2
P. 261
IPS236 Ksenija D. et al.
for X2_AccHome (CV=10.14%). Regardless the high outlier for the variable
X1GDPpcPPS for Ireland, with standardized value of ZIE= 2.86, it was remained for
the further analysis. The same moderate low extremes were found for FYR of
Macedonia and Serbia (ZMK= ZRS= -1.56).
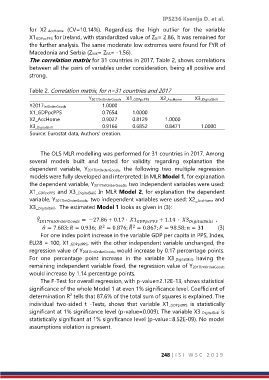
The correlation matrix for 31 countries in 2017, Table 2, shows correlations
between all the pairs of variables under consideration, being all positive and
strong.
Table 2. Correlation matrix, for n=31 countries and 2017
Y2017IntOrderGoods X1_GDPpcPPS X2_AccHome X3_DigitalSkill
Y2017IntOrderGoods 1.0000
X1_GDPpcPPS 0.7654 1.0000
X2_AccHome 0.9027 0.8129 1.0000
X3_DigitalSkill 0.9166 0.6852 0.8471 1.0000
Source: Eurostat data, Authors’ creation.
The OLS MLR modelling was performed for 31 countries in 2017. Among
several models built and tested for validity regarding explanation the
dependent variable, Y2017IntOrderGoods, the following two multiple regression
models were fully developed and interpreted: In MLR Model 1, for explanation
the dependent variable, Y2017IntOrderGoods, two independent variables were used:
X1_GDPpcPPS and X3_DigitalSkill; In MLR Model 2, for explanation the dependent
variable, Y2017IntOrderGoods, two independent variables were used: X2_AccHome and
X3_DigitalSkill. The estimated Model 1 looks as given in (3):
̂ 2017 = −27.86 + 0.17 · 1 + 1.14 · 3 ,
̂ = 7.683; = 0.936; = 0.876; = 0.867; = 98.58; = 31 (3)
̅
2
2
For one index point increase in the variable GDP per capita in PPS, Index,
EU28 = 100, X1_GDPpcPPS, with the other independent variable unchanged, the
regression value of Y2017IntOrderGoods, would increase by 0.17 percentage points.
For one percentage point increase in the variable X3_DigitalSkill, having the
remaining independent variable fixed, the regression value of Y2017IntOrderGoods
would increase by 1.14 percentage points.
The F-Test for overall regression, with p-value=2.12E-13, shows statistical
significance of the whole Model 1 at even 1% significance level. Coefficient of
2
determination R tells that 87.6% of the total sum of squares is explained. The
individual two-sided t -Tests, shows that variable X1_GDPpcPPS is statistically
significant at 1% significance level (p-value=0.009). The variable X3_DigitalSkill is
statistically significant at 1% significance level (p-value=8.52E-09). No model
assumptions violation is present.
248 | I S I W S C 2 0 1 9