
Page 262 - Invited Paper Session (IPS) - Volume 2
P. 262
IPS236 Ksenija D. et al.
The estimated Model 2 is given in (4):
̂
2017 = −89.61 + 0.12 · 2 2 + 0.83 · 3 ,
̅
̂ = 7.008; = 0.947; = 0.897; = 0.889; = 121.30; = 31. (4)
2
2
For one index point increase in the variable X2_AccHome, with the other
independent variable unchanged, the regression value of Y2017IntOrderGoods,
would increase by 0.17 percentage points. For one percentage point increase
in the variable X3_DigitalSkill, having the remaining independent variable fixed, the
regression value of Y2017IntOrderGoods would increase by 0.83 percentage points.
2
Coefficient of determination R shows that 99.7% of the total sum of squares
is explained by Model 2. Since the overall F-Test has p-value = 1.61E-14, the
whole regression Model 1 is statistically significant at 1% significance level.
Using two-sided t-Test, the variable X2_AccHome is statistically significant, with t-
statistic = 3.908 and p-value = 0.0005, at 1 % significance level. The variable
X3_DigitalSkill is statistically significant, with p-value = 0.0001, at 1% significance
level, too. Regression diagnostics’ tests for residuals were performed, showing
no assumptions violation is present.
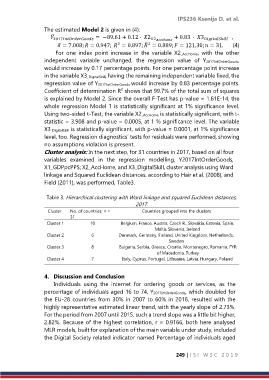
Cluster analysis: In the next step, for 31 countries in 2017, based on all four
variables examined in the regression modelling, Y2017IntOrderGoods,
X1_GDPpcPPS; X2_AccHome, and X3_DigitalSkill, cluster analysis using Ward
linkage and Squared Euclidean distances, according to Hair et al. (2008), and
Field (2011), was performed, Table3.
Table 3. Hierarchical clustering with Ward linkage and squared Euclidean distances,
2017.
Cluster No. of countries; n = Countries grouped into the clusters
31
Cluster 1 10 Belgium, France, Austria, Czech R., Slovakia, Estonia, Spain,
Malta, Slovenia, Ireland
Cluster 2 6 Denmark, Germany, Finland, United Kingdom, Netherlands,
Sweden
Cluster 3 8 Bulgaria, Serbia, Greece, Croatia, Montenegro, Romania, FYR
of Macedonia, Turkey
Cluster 4 7 Italy, Cyprus, Portugal, Lithuania, Latvia, Hungary, Poland
4. Discussion and Conclusion
Individuals using the internet for ordering goods or services, as the
percentage of individuals aged 16 to 74, Y2017IntOrderGoods, which doubled for
the EU-28 countries from 30% in 2007 to 60% in 2018, resulted with the
highly representative estimated linear trend, with the yearly slope of 2.73%.
For the period from 2007 until 2015, such a trend slope was a little bit higher,
2.82%. Because of the highest correlation, r = 0.9166, both here analysed
MLR models, built for explanation of the main variable under study, included
the Digital Society related indicator named Percentage of individuals aged
249 | I S I W S C 2 0 1 9