
Page 259 - Invited Paper Session (IPS) - Volume 2
P. 259
IPS236 Ksenija D. et al.
X3_DigitalSkill, Percentage of individuals aged 16-74, who have basic or
above basic overall digital skills.
Firstly, an Ordinary Least Squares (OLS) liner trend model for the variable
Y2017IntOrderGoods for the EU28 area over the period 2007 to 2018, and short term
forecasts for 2019 and 2020 were estimated.
Further, all four considered variables are described using Descriptive
Statistics for 31 countries, as shown in Table 1. Since, in exploratory data
analysis the Luxembourg’s data for X1_GDPpcPPS appeared to be a serious outlier,
with z= 3.84, it must be removed from further analysis. The EU-28 countries,
without Luxembourg, with Montenegro, FYR of Macedonia, Serbia and Turkey,
in 2017 proceeded for the further analysis.
Multiple linear regression (MLR) analysis, using the software Megastat and
EViews, was used, Gujaraty & Porter (2010). The population model is given in
(1):
= + ∑ + = 1,2, … . . , (1)
0
,
,
=1
Regression parameters are estimated using the OLS method. The model
with estimated parameters is given in (2):
̂
̂
̂ = + ∑ , = 1,2, … . . , (2)
,
0
=1
And, finally, for Y2017IntOrderGoods, and three explanatory variables, X1_GDPpcPPS,
X2_AccHome and X3_DigitalSkill, a hierarchical cluster analysis was performed.
3. Results
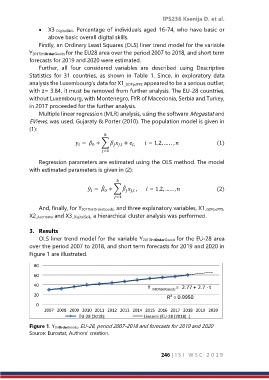
OLS liner trend model for the variable Y2017IntOrderGoods for the EU-28 area
over the period 2007 to 2018, and short term forecasts for 2019 and 2020 in
Figure 1 are illustrated.
80
60
40 Y IntOrderGoods = 2 . 77 + 2 . 7 · t
20
R² = 0.9950
0
2007 2008 2009 2010 2011 2012 2013 2014 2015 2016 2017 2018 2019 2020
EU-28 (2018): Linearni (EU-28 (2018) :)
Figure 1. Y IntOrderGoods, EU-28, period 2007-2018 and forecasts for 2019 and 2020
Source: Eurostat, Authors’ creation.
246 | I S I W S C 2 0 1 9