
Page 260 - Invited Paper Session (IPS) - Volume 2
P. 260
IPS236 Ksenija D. et al.
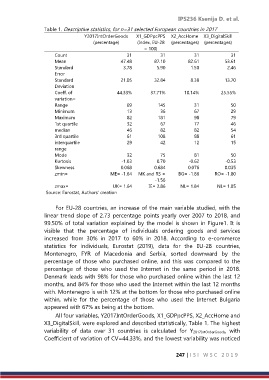
Table 1. Descriptive statistics, for n=31 selected European countries in 2017
Y2017IntOrderGoods X1_GDPpcPPS X2_AccHome X3_DigitalSkill
(percentage) (Index, EU-28 (percentages) (percentages)
= 100)
Count 31 31 31 31
Mean 47.48 87.10 82.61 53.61
Standard 3.78 5.90 1.50 2.46
Error
Standard 21.05 32.84 8.38 13.70
Deviation
Coeff. of 44.33% 37.71% 10.14% 25.55%
variation=
Range 69 145 31 50
Minimum 13 36 67 29
Maximum 82 181 98 79
1st quartile 32 67 77 46
median 46 82 82 54
3rd quartile 61 108 88 61
interquartile 29 42 12 15
range
Mode 32 75 81 50
Kurtosis -1.03 0.70 -0.62 -0.53
Skewness 0.068 0.684 0.076 0.035
zmin= ME= -1.64 MK and RS = BG= -1.86 RO= -1.80
-1.56
zmax= UK= 1.64 IE= 2.86 NL= 1.84 NL= 1.85
Source: Eurostat, Authors’ creation
For EU-28 countries, an increase of the main variable studied, with the
linear trend slope of 2.73 percentage points yearly over 2007 to 2018, and
99.50% of total variation explained by the model is shown in Figure1. It is
visible that the percentage of individuals ordering goods and services
increased from 30% in 2017 to 60% in 2018. According to e-commerce
statistics for individuals, Eurostat (2019), data for the EU-28 countries,
Montenegro, FYR of Macedonia and Serbia, sorted downward by the
percentage of those who purchased online, and this was compared to the
percentage of those who used the Internet in the same period in 2018.
Denmark leads with 98% for those who purchased online within the last 12
months, and 84% for those who used the Internet within the last 12 months
with. Montenegro is with 12% at the bottom for those who purchased online
within, while for the percentage of those who used the Internet Bulgaria
appeared with 67% as being at the bottom.
All four variables, Y2017IntOrderGoods, X1_GDPpcPPS, X2_AccHome and
X3_DigitalSkill, were explored and described statistically, Table 1. The highest
variability of data over 31 countries is calculated for Y2017IntOrderGoods, with
Coefficient of variation of CV=44.33%, and the lowest variability was noticed
247 | I S I W S C 2 0 1 9