
Page 223 - Special Topic Session (STS) - Volume 2
P. 223
STS486 R. Ayesha A. et al.
method never returned an underfit model or a model with false negatives, and
all MMSE values were relatively low. For a given network size, the adaptive
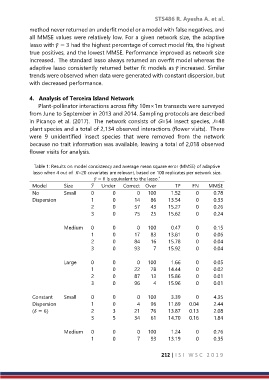
lasso with ̃ = 3 had the highest percentage of correct model fits, the highest
true positives, and the lowest MMSE. Performance improved as network size
increased. The standard lasso always returned an overfit model whereas the
adaptive lasso consistently returned better fit models as ̃ increased. Similar
trends were observed when data were generated with constant dispersion, but
with decreased performance.
4. Analysis of Terceira Island Network
Plant-pollinator interactions across fifty 10m×1m transects were surveyed
from June to September in 2013 and 2014. Sampling protocols are described
in Picanço et al. (2017). The network consists of G=54 insect species, J=48
plant species and a total of 2,134 observed interactions (flower visits). There
were 9 unidentified insect species that were removed from the network
because no trait information was available, leaving a total of 2,018 observed
flower visits for analysis.
Table 1: Results on model consistency and average mean square error (MMSE) of adaptive
lasso when 4 out of K=20 covariates are relevant, based on 100 replicates per network size.
*
̃ = 0 is equivalent to the lasso.
Model Size ̃ Under Correct Over TP FN MMSE
No Small 0 0 0 100 1.52 0 0.78
Dispersion 1 0 14 86 13.54 0 0.33
2 0 57 43 15.27 0 0.26
3 0 75 25 15.62 0 0.24
Medium 0 0 0 100 0.47 0 0.15
1 0 17 83 13.81 0 0.06
2 0 84 16 15.78 0 0.04
3 0 93 7 15.92 0 0.04
Large 0 0 0 100 1.66 0 0.05
1 0 22 78 14.44 0 0.02
2 0 87 13 15.86 0 0.01
3 0 96 4 15.96 0 0.01
Constant Small 0 0 0 100 3.39 0 4.35
Dispersion 1 0 4 96 11.89 0.04 2.44
( = 6) 2 3 21 76 13.87 0.13 2.08
3 5 34 61 14.70 0.16 1.84
Medium 0 0 0 100 1.24 0 0.76
1 0 7 93 13.19 0 0.35
212 | I S I W S C 2 0 1 9